Archives

This is How Canada Talks

Spread across a vast landmass, Canada’s roughly 30 million anglophones speak something called Canadian English. The stereotype often goes that Canadian English is a lot like American English in terms of both vocabulary and pronunciation, with significant influence from the British Isles, resulting in words like zed and spellings like colour and centre. A subtle Canadian accent that affects the vowels in words like about and write, and a collection of characteristic Canadian vocabulary like chesterfield, toque, poutine and bunnyhug, add to its uniqueness.

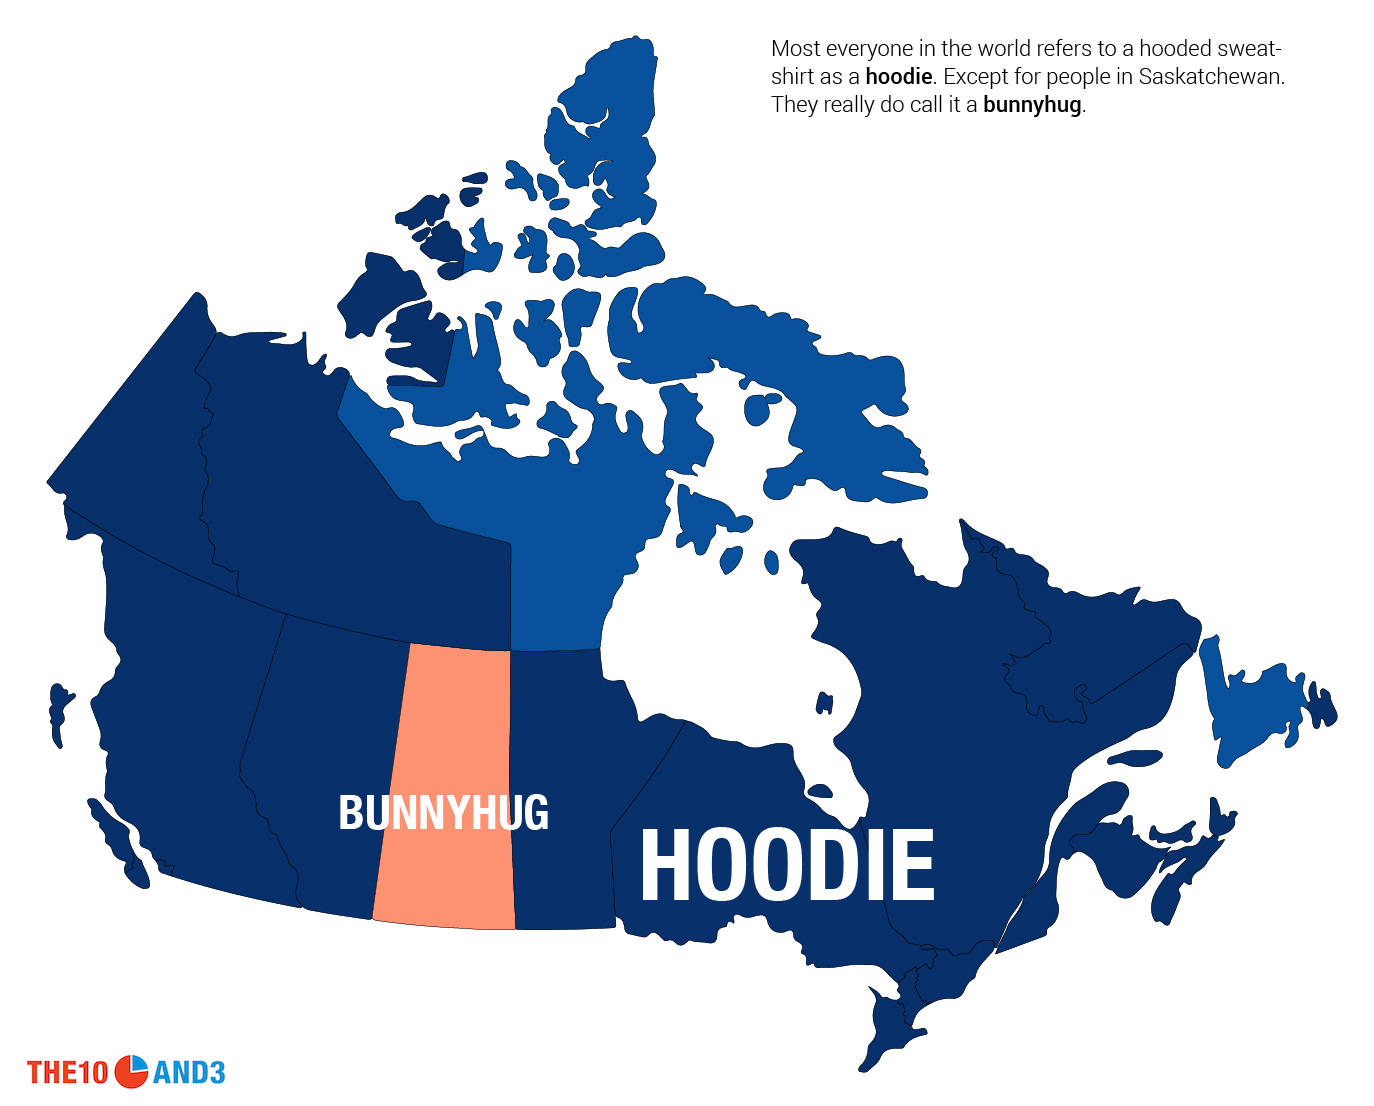
Wait, bunnyhug? Yes, bunnyhug is a very Canadian word (for a hooded sweatshirt), but you’ve probably never heard of it if you live outside of Saskatchewan. It turns out that there is a surprising amount of diversity within Canada when it comes to how we talk and the words we use. Of course, everyone knows about the characteristic English of Newfoundland, and regions like Cape Breton, Lunenberg and the Ottawa Valley also have unique ways of speaking. But even in other places that have no obvious reason to talk differently, Canadians have developed strong regionalisms.
“Convenience

Charles Boberg, an Associate Professor of Linguistics at McGill University, suggests that in addition to the influence of French as well as historical settlement patterns, much of our country’s language regionalism is due to “simple isolation.” While we can now easily communicate and interact with Canadians from all corners of the country, that was obviously not always the case. “[With] a relatively small population spread out over 5000 km … local cultures, which include unique vocabulary, have a chance to develop in each region, even over the relatively short time span of one or two centuries, without diffusing to other regions.” This isolation has given rise to some fascinating linguistic trends.

The Survey

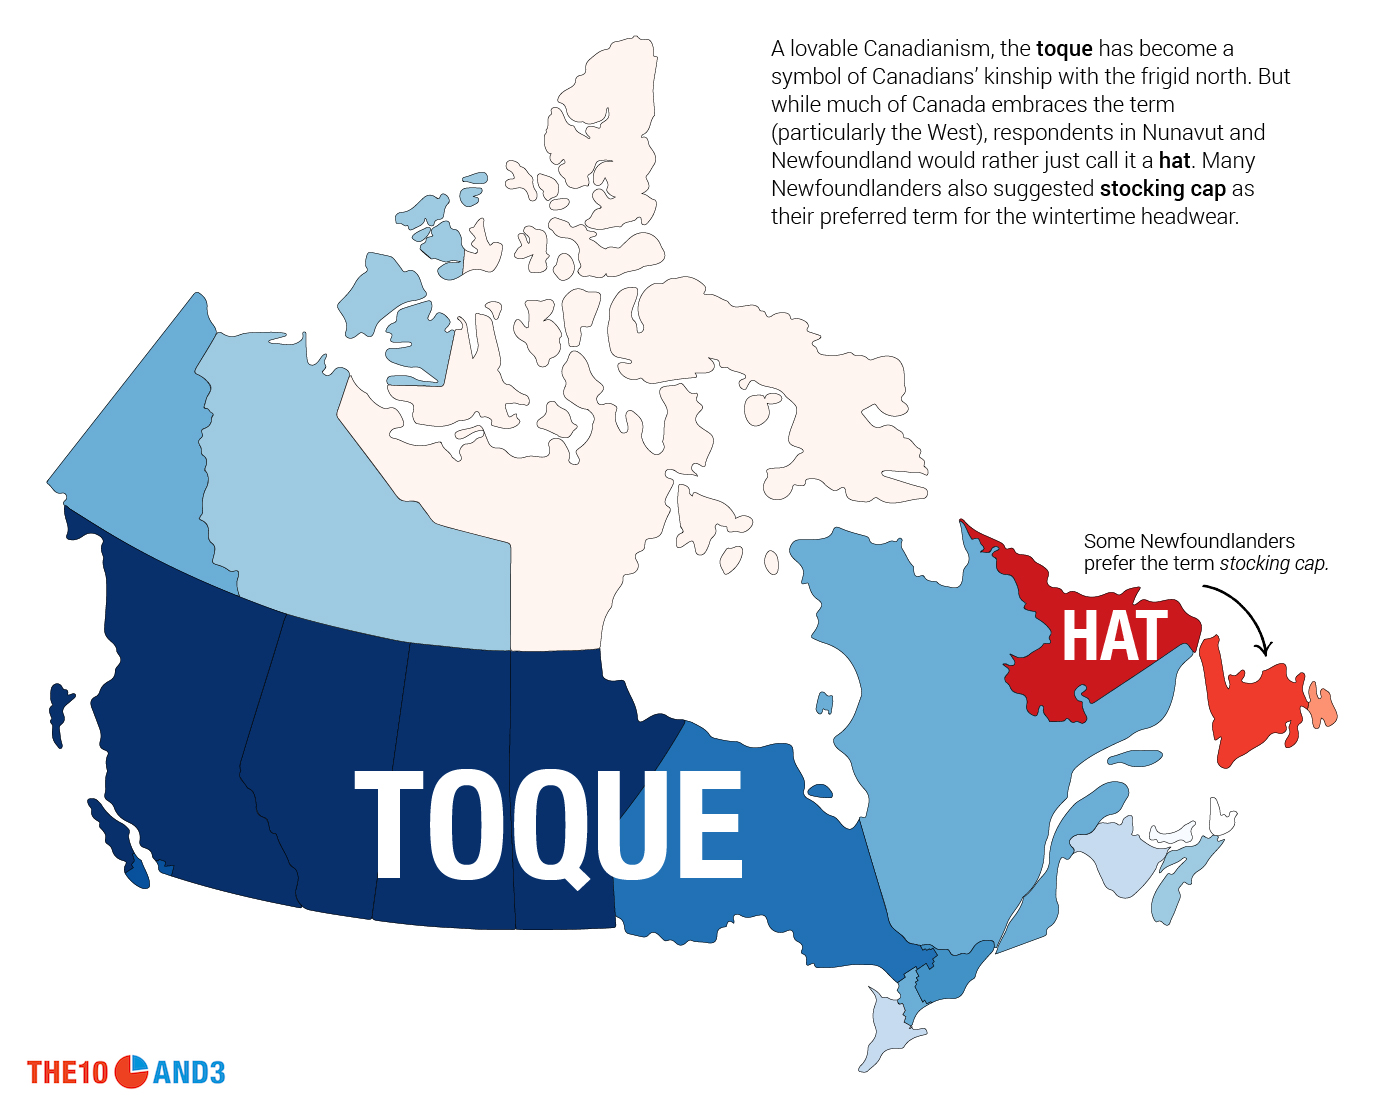
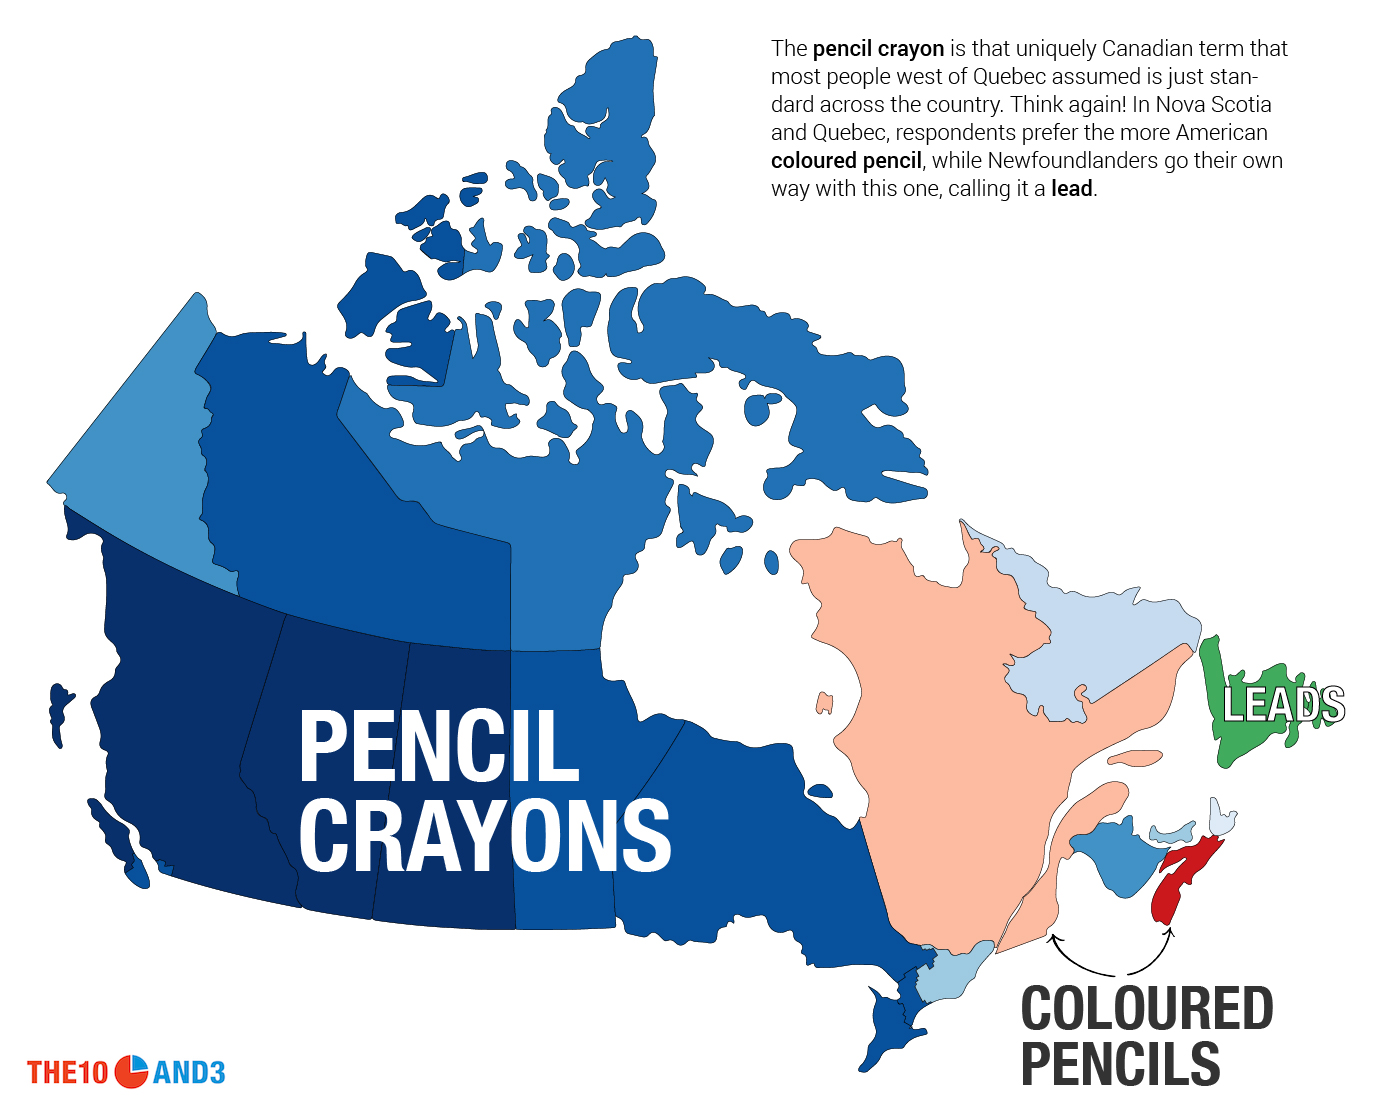
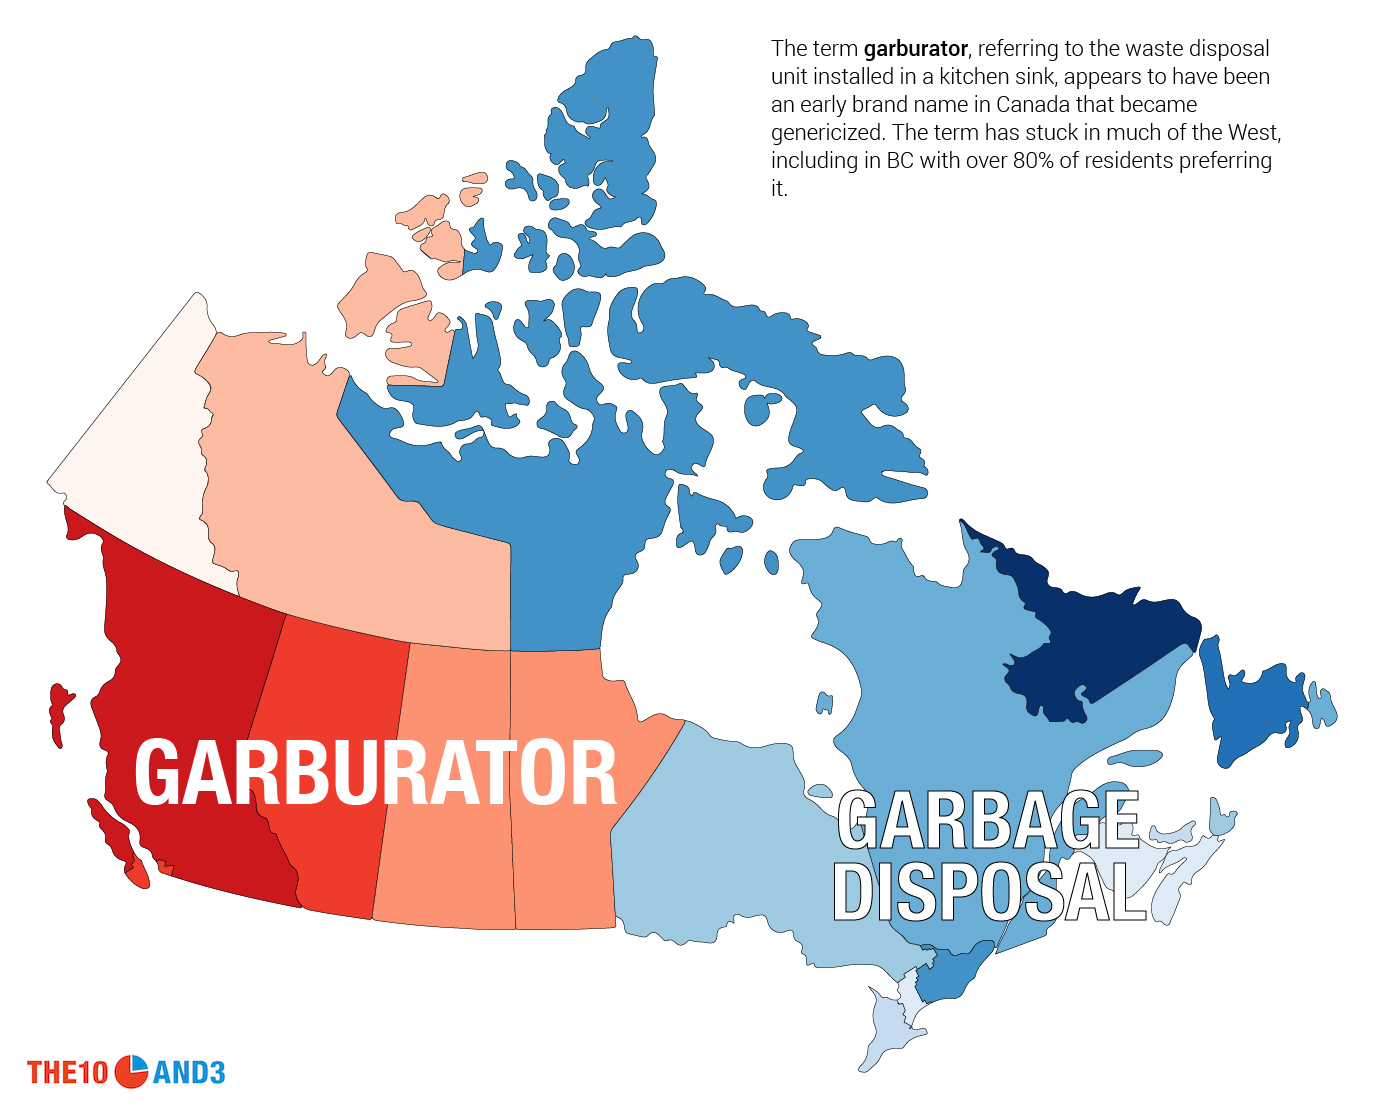
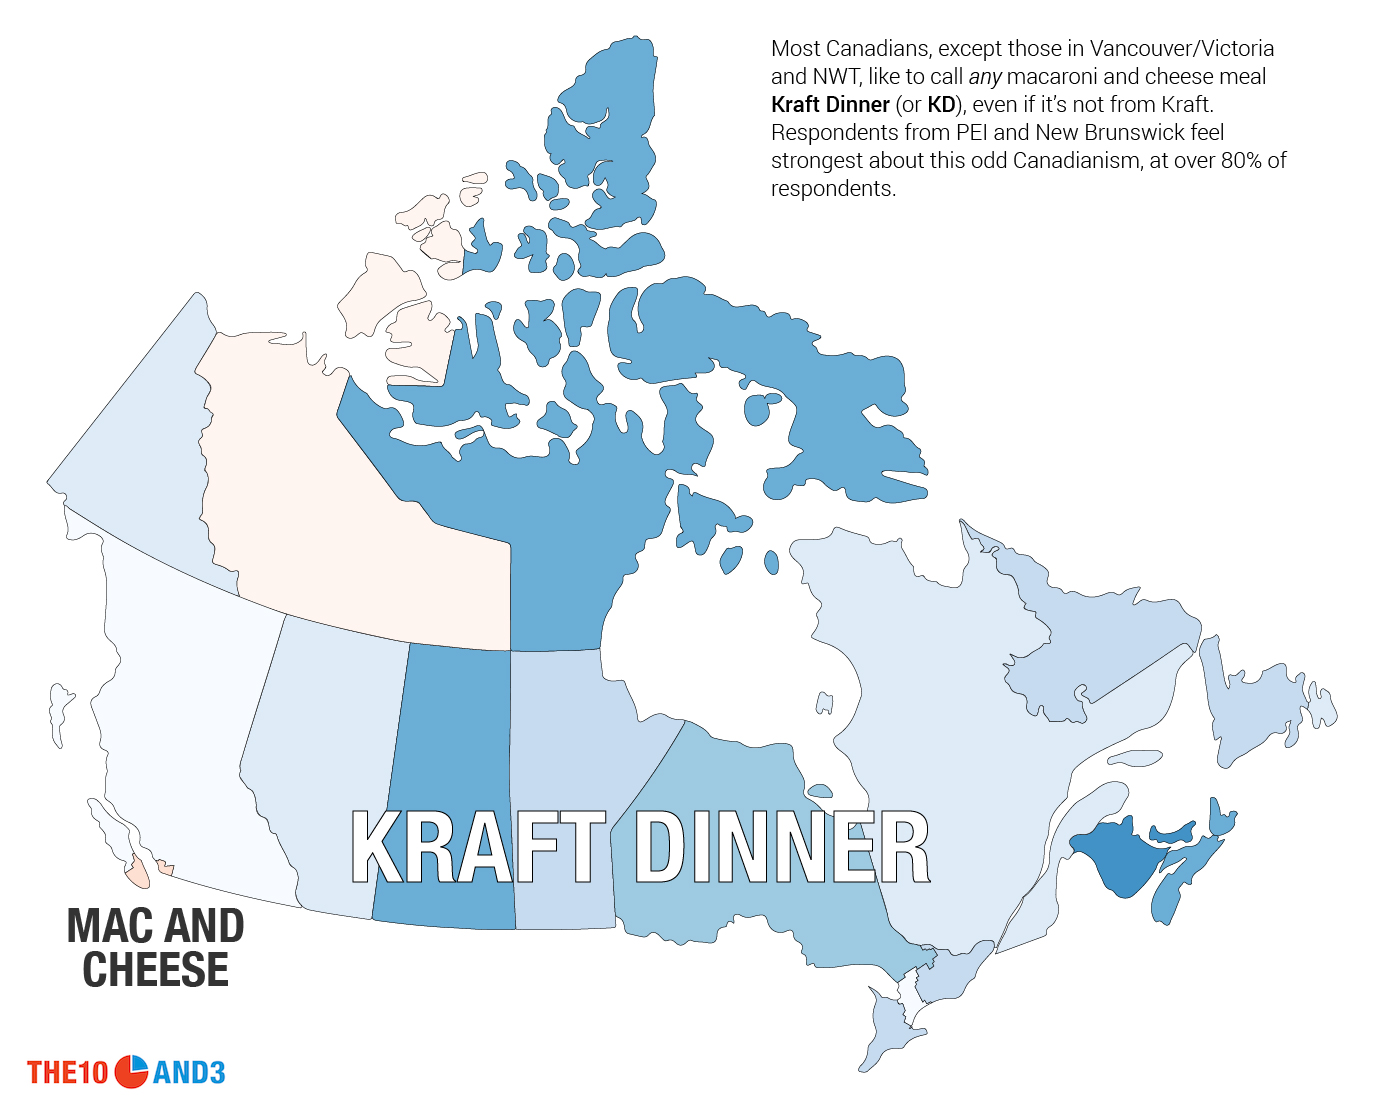
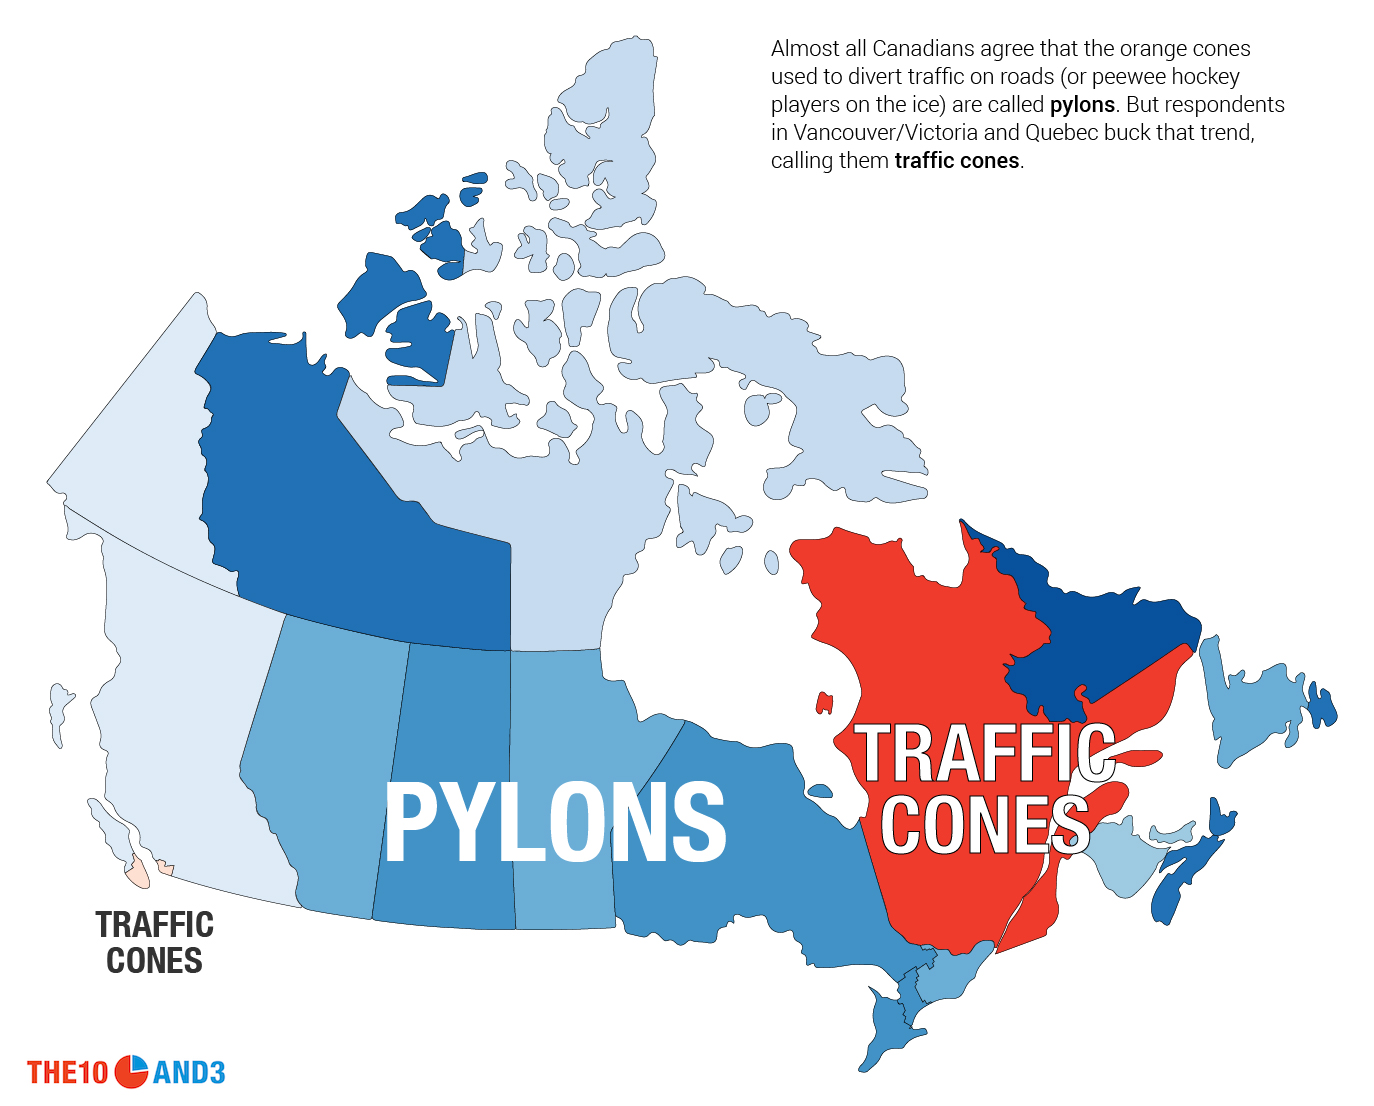
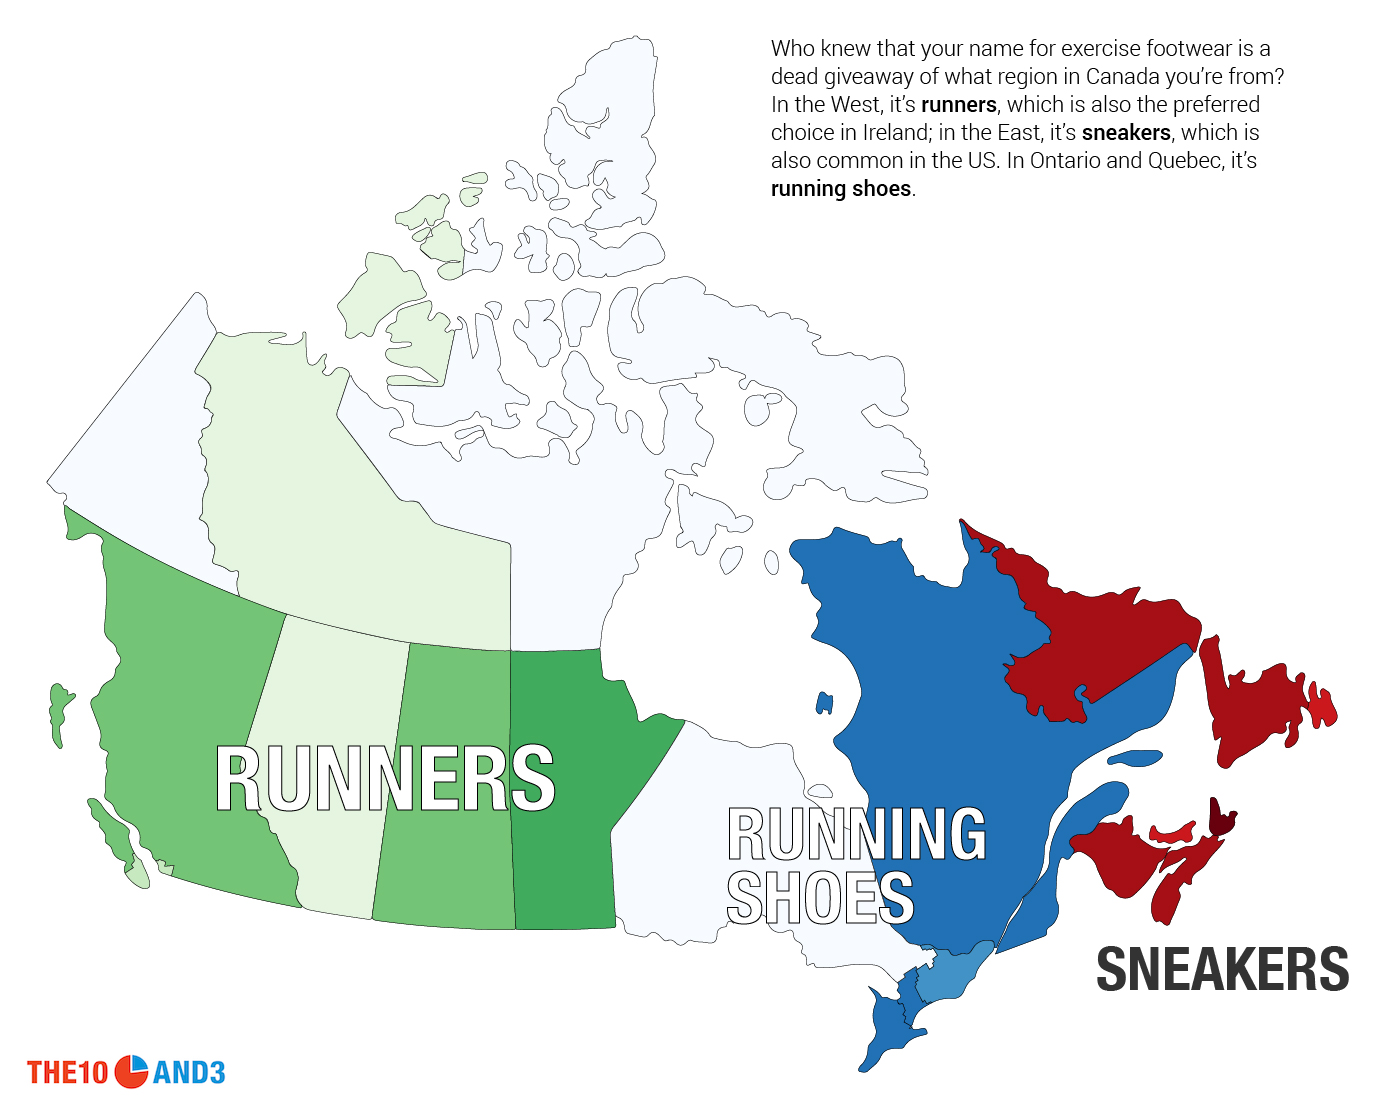
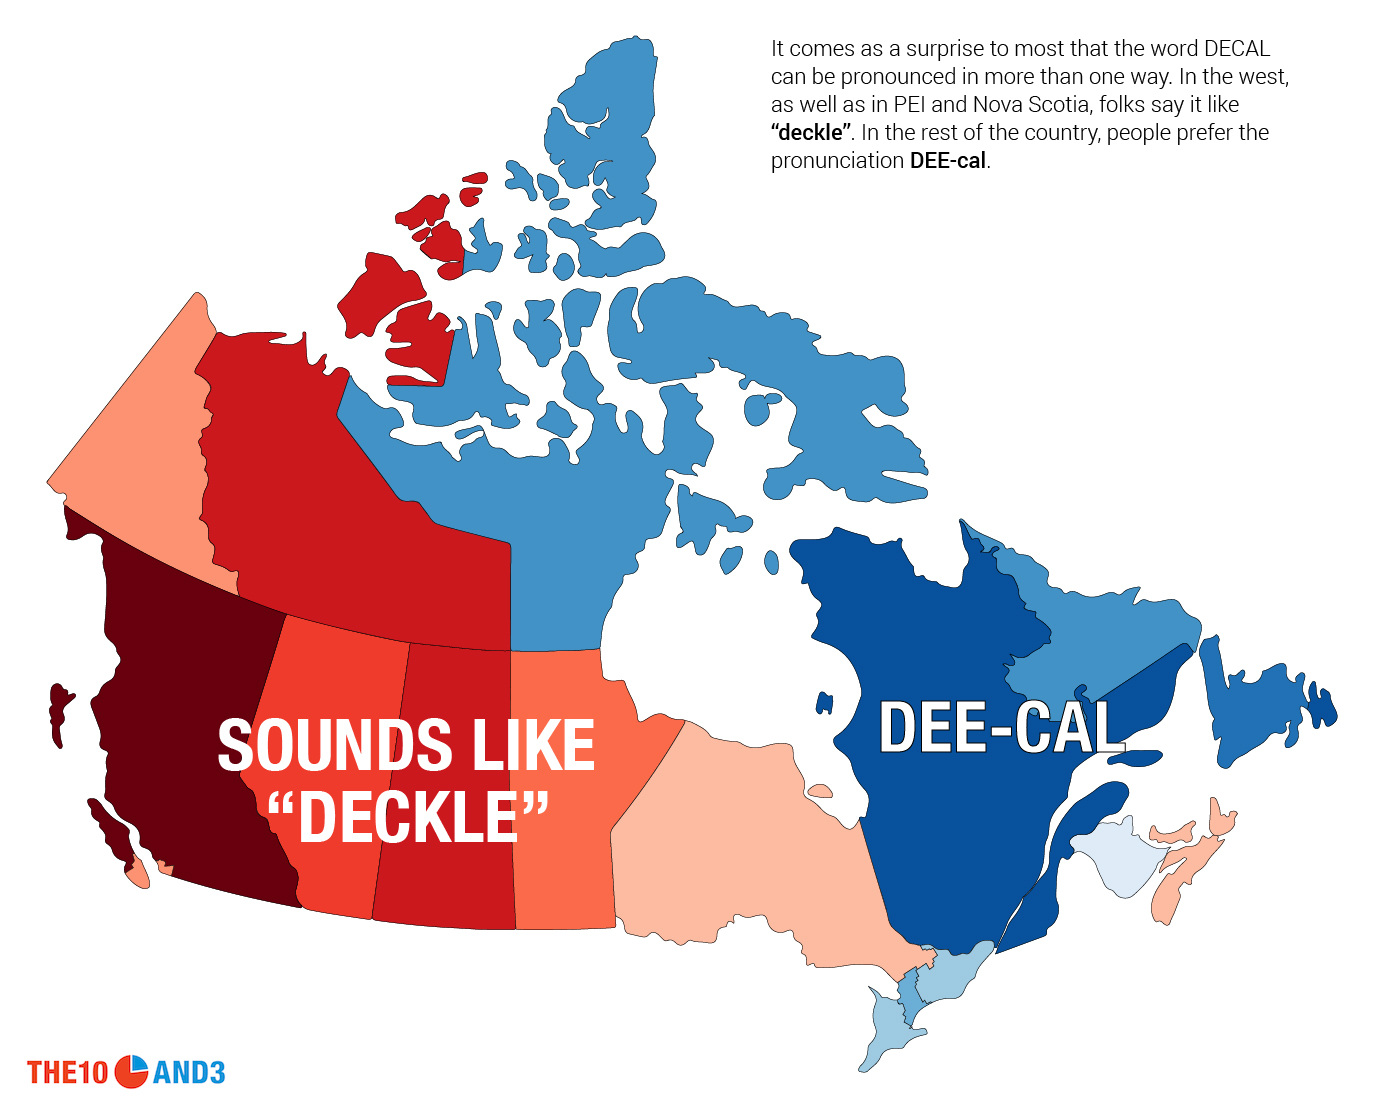
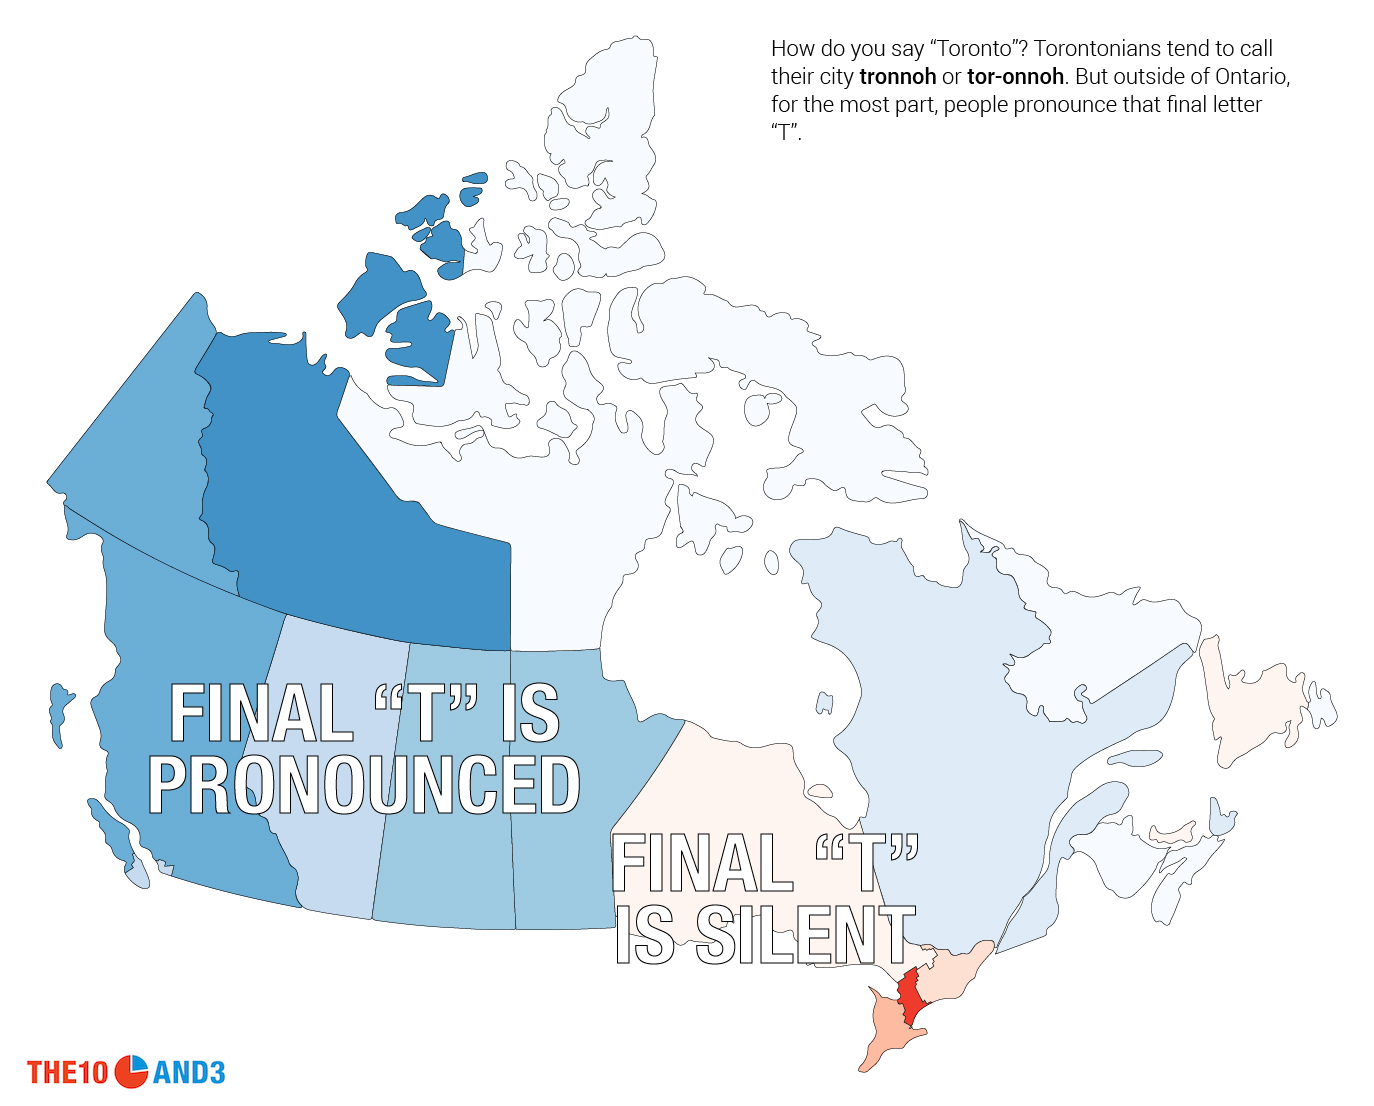
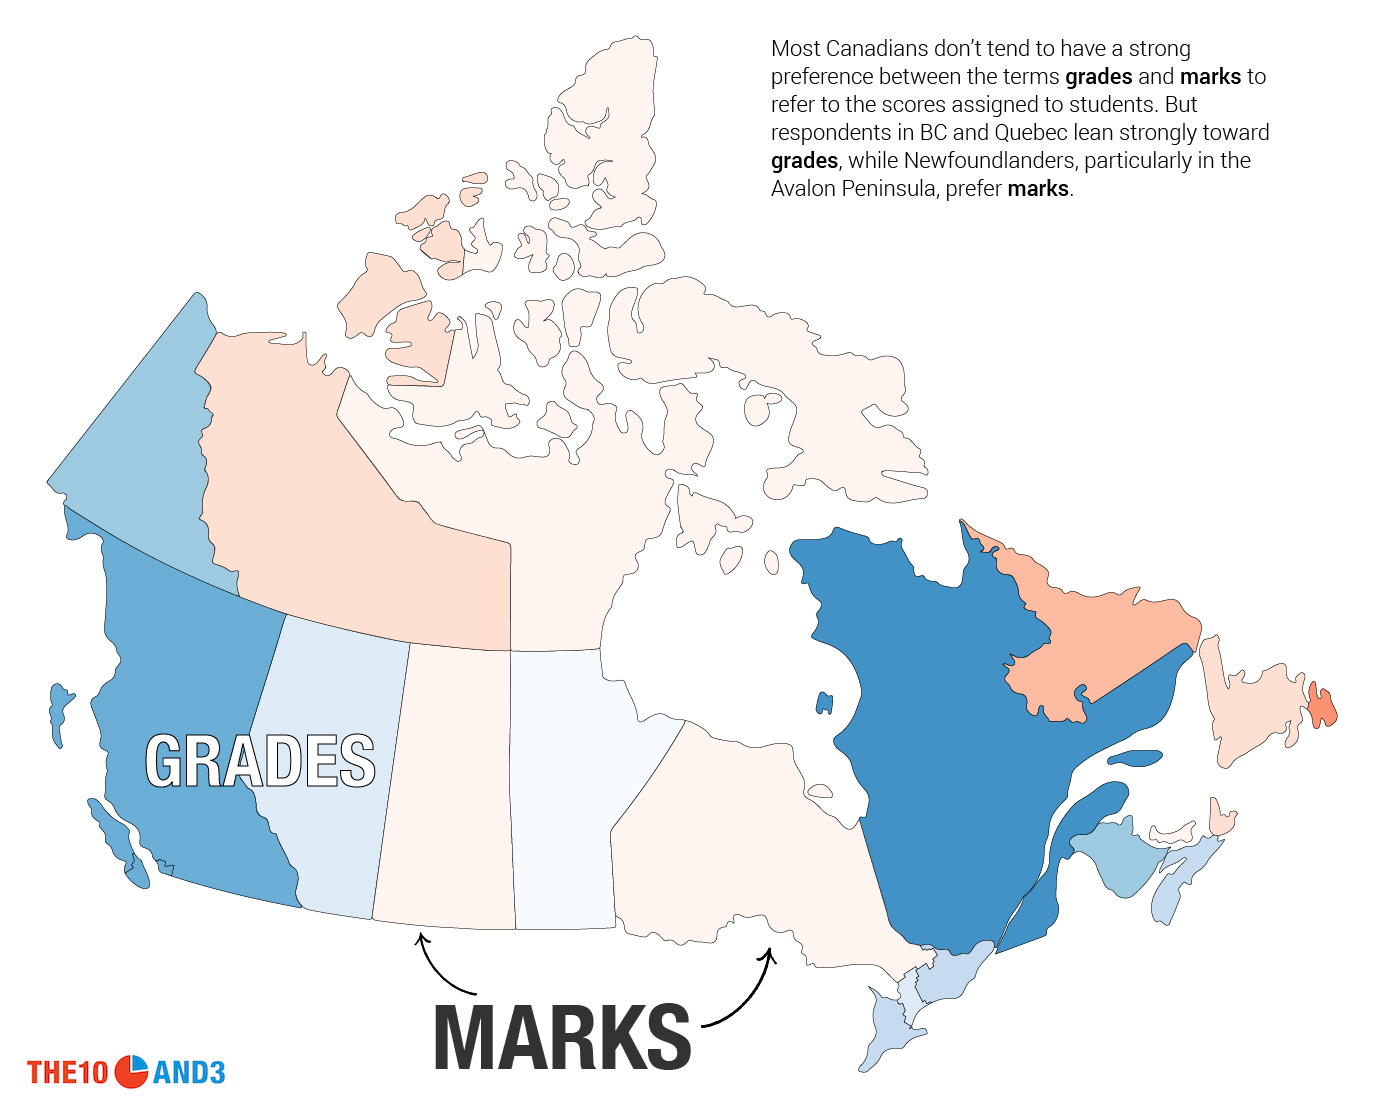
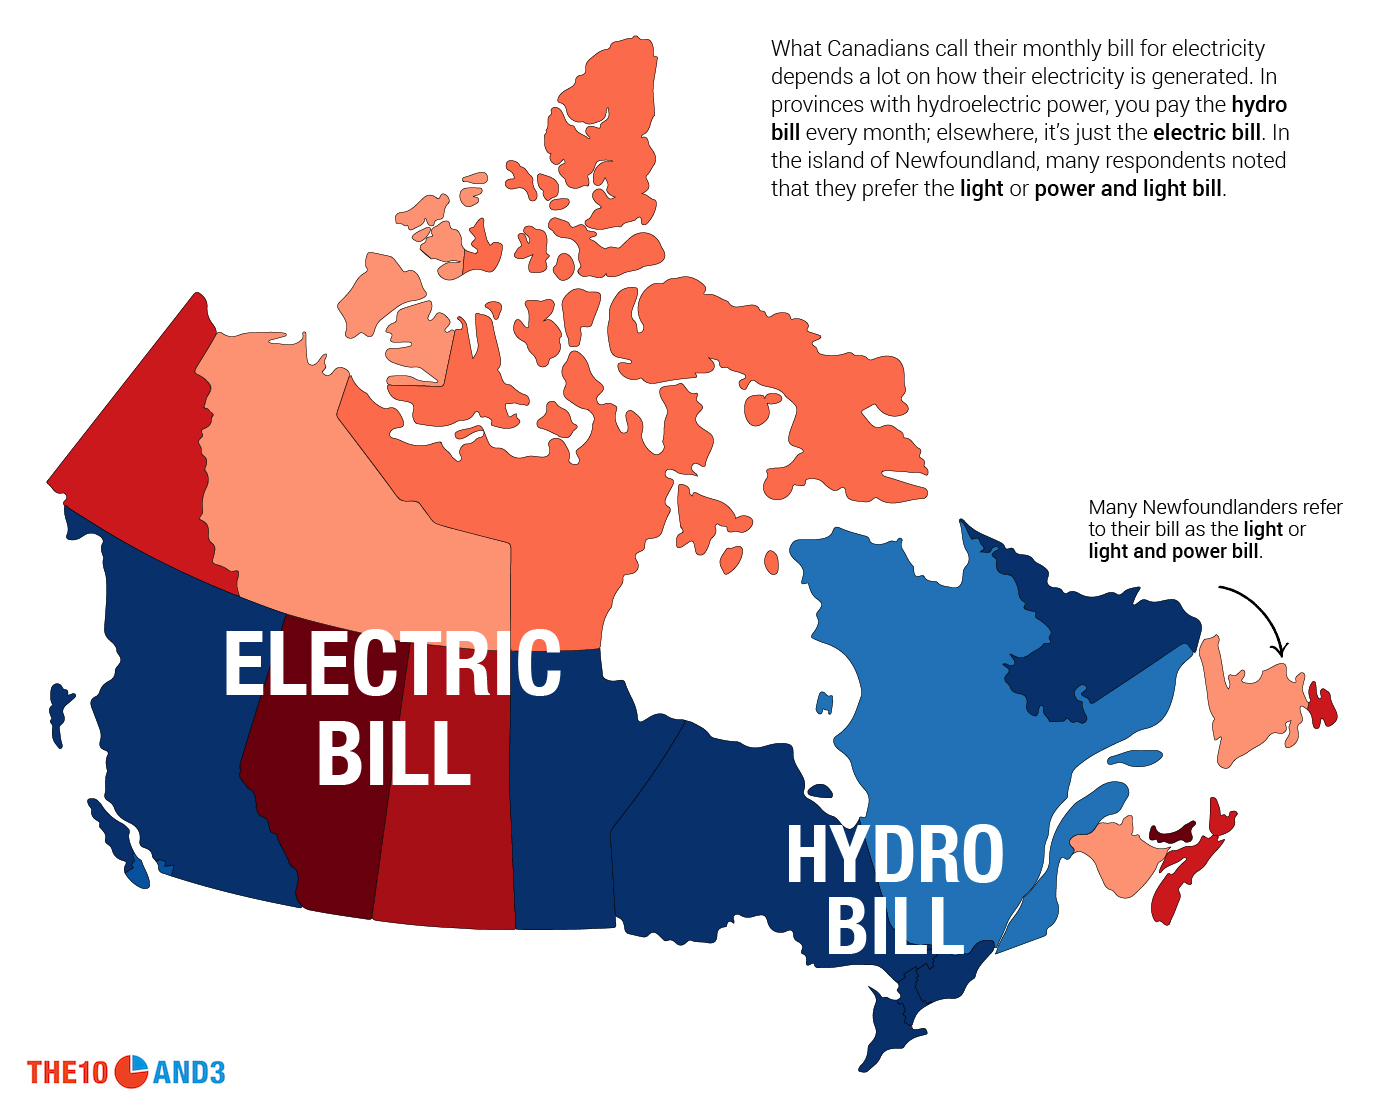
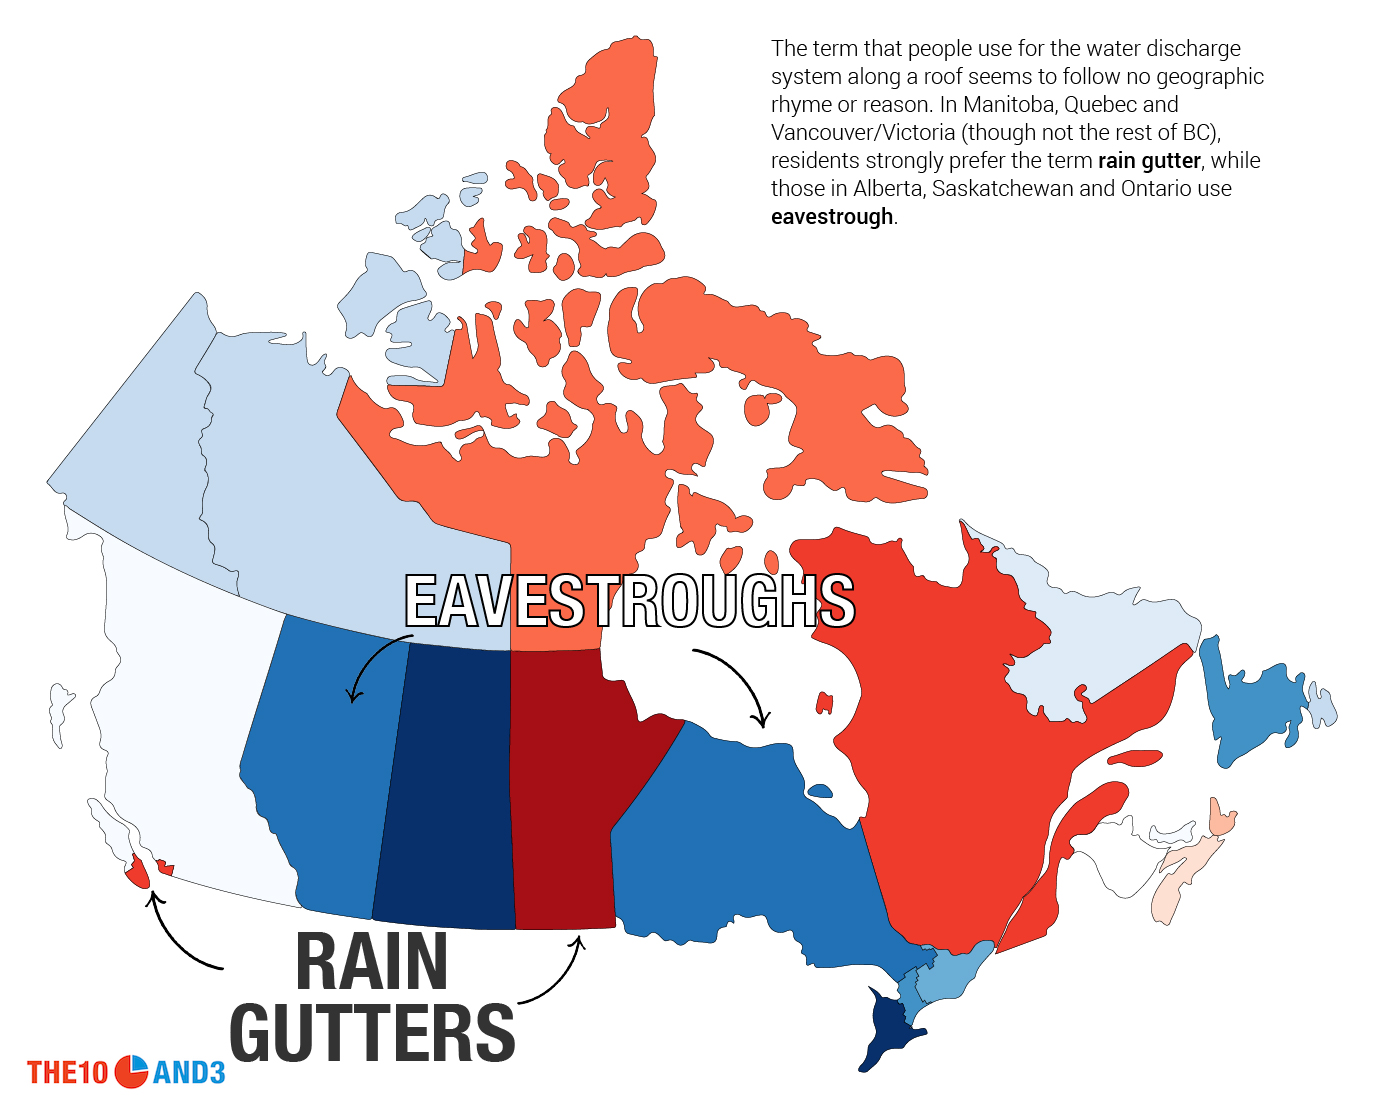
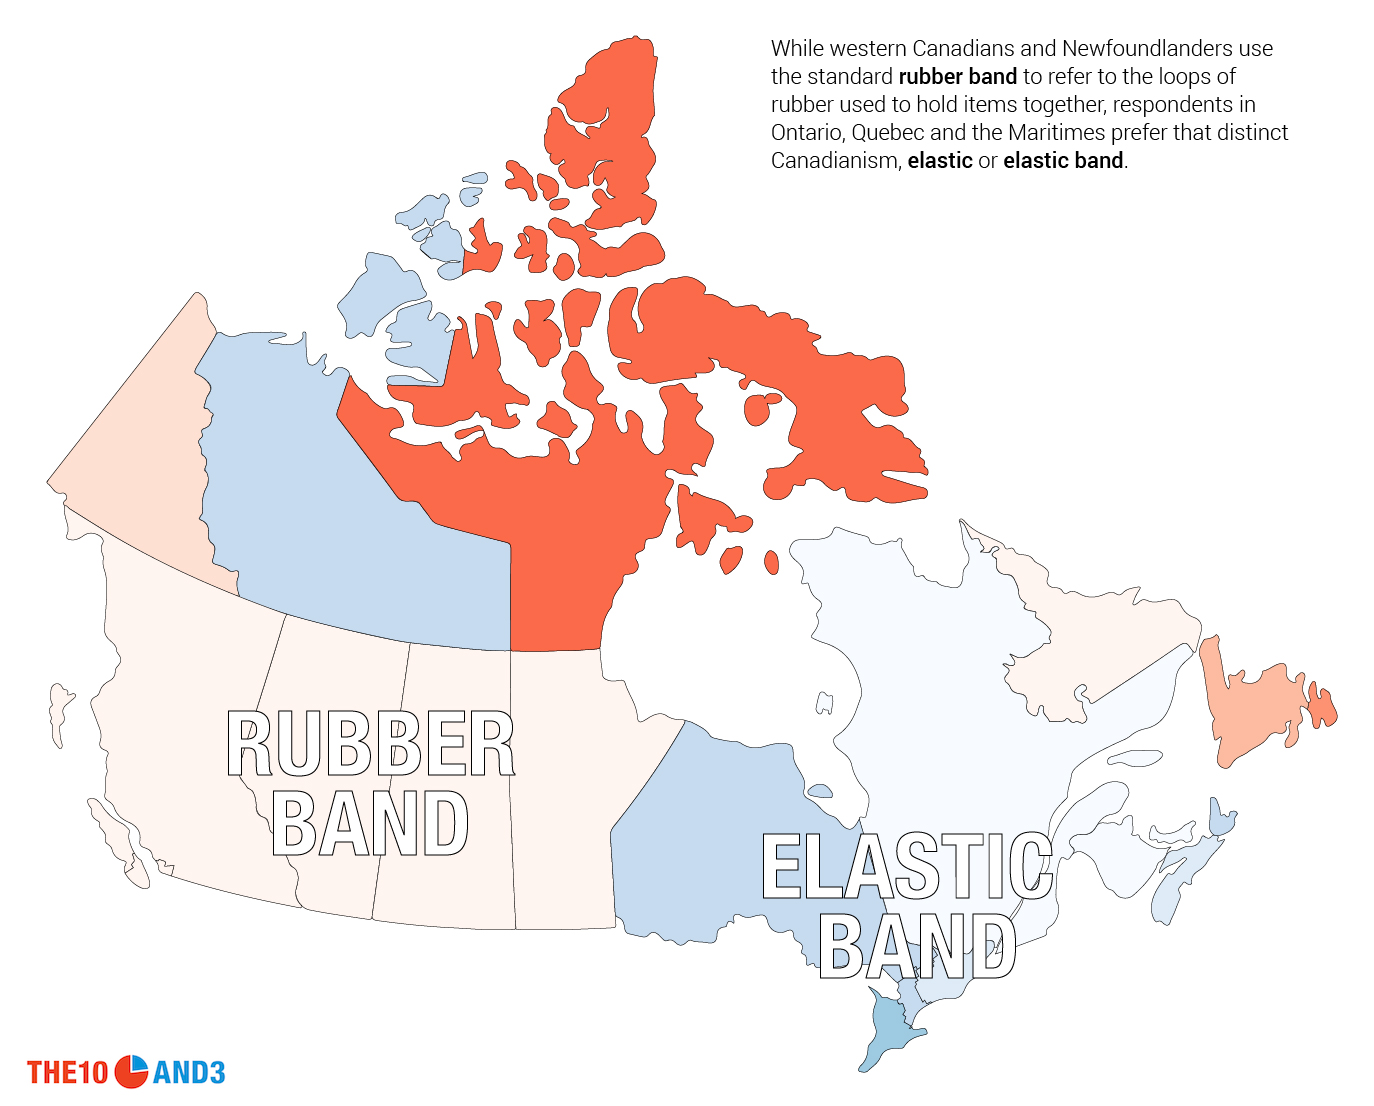
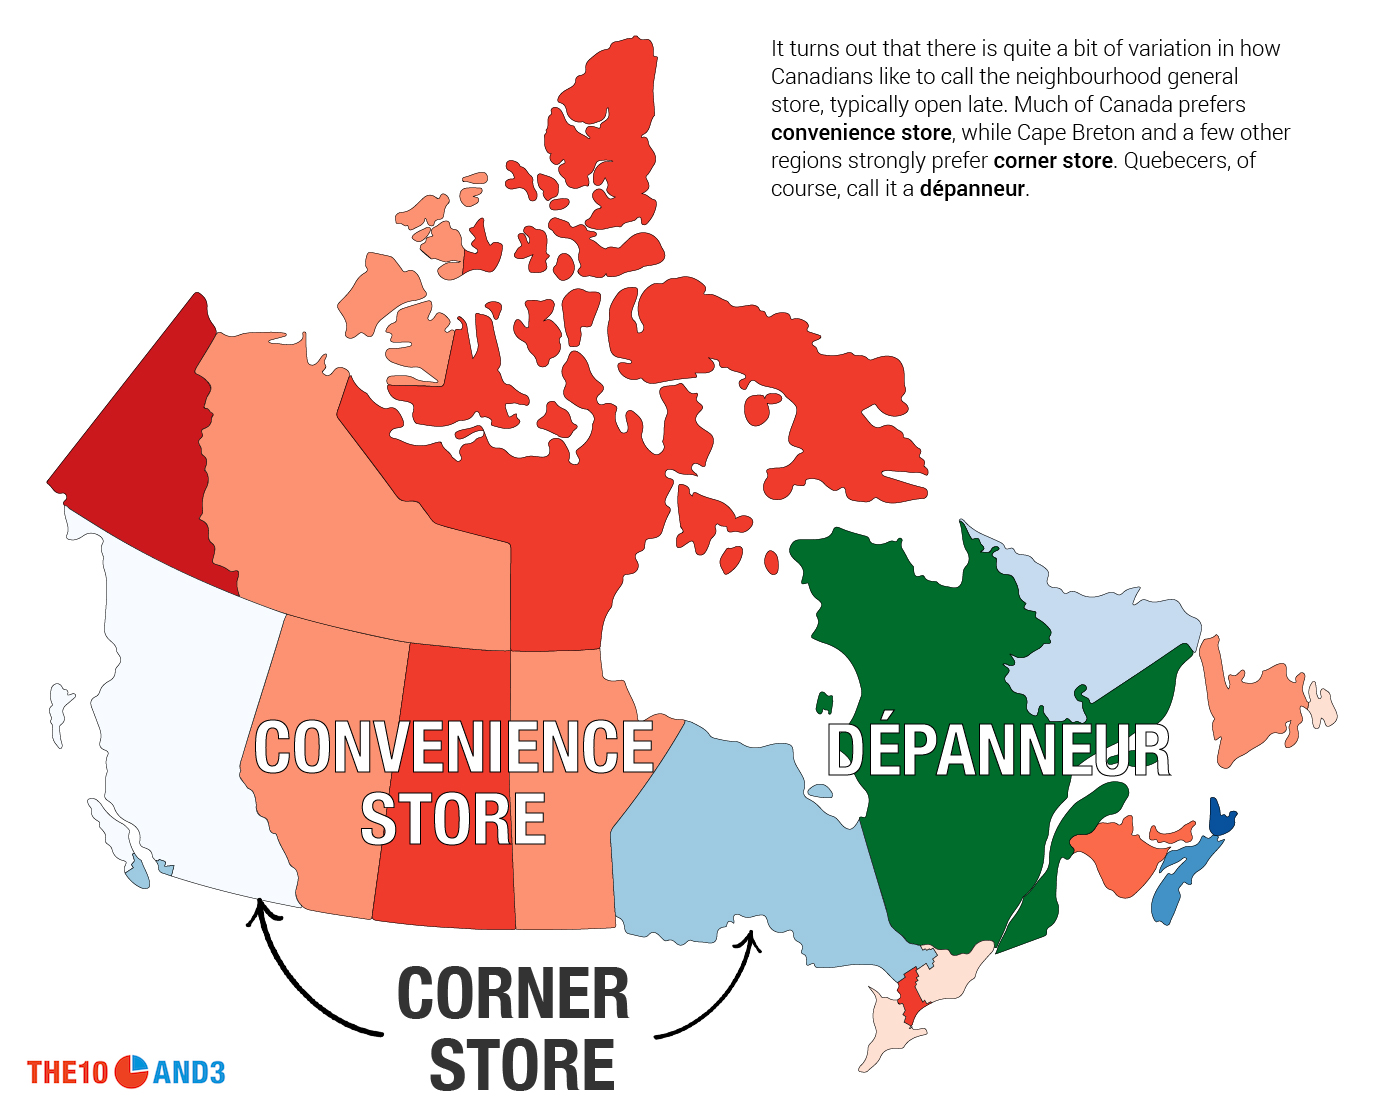
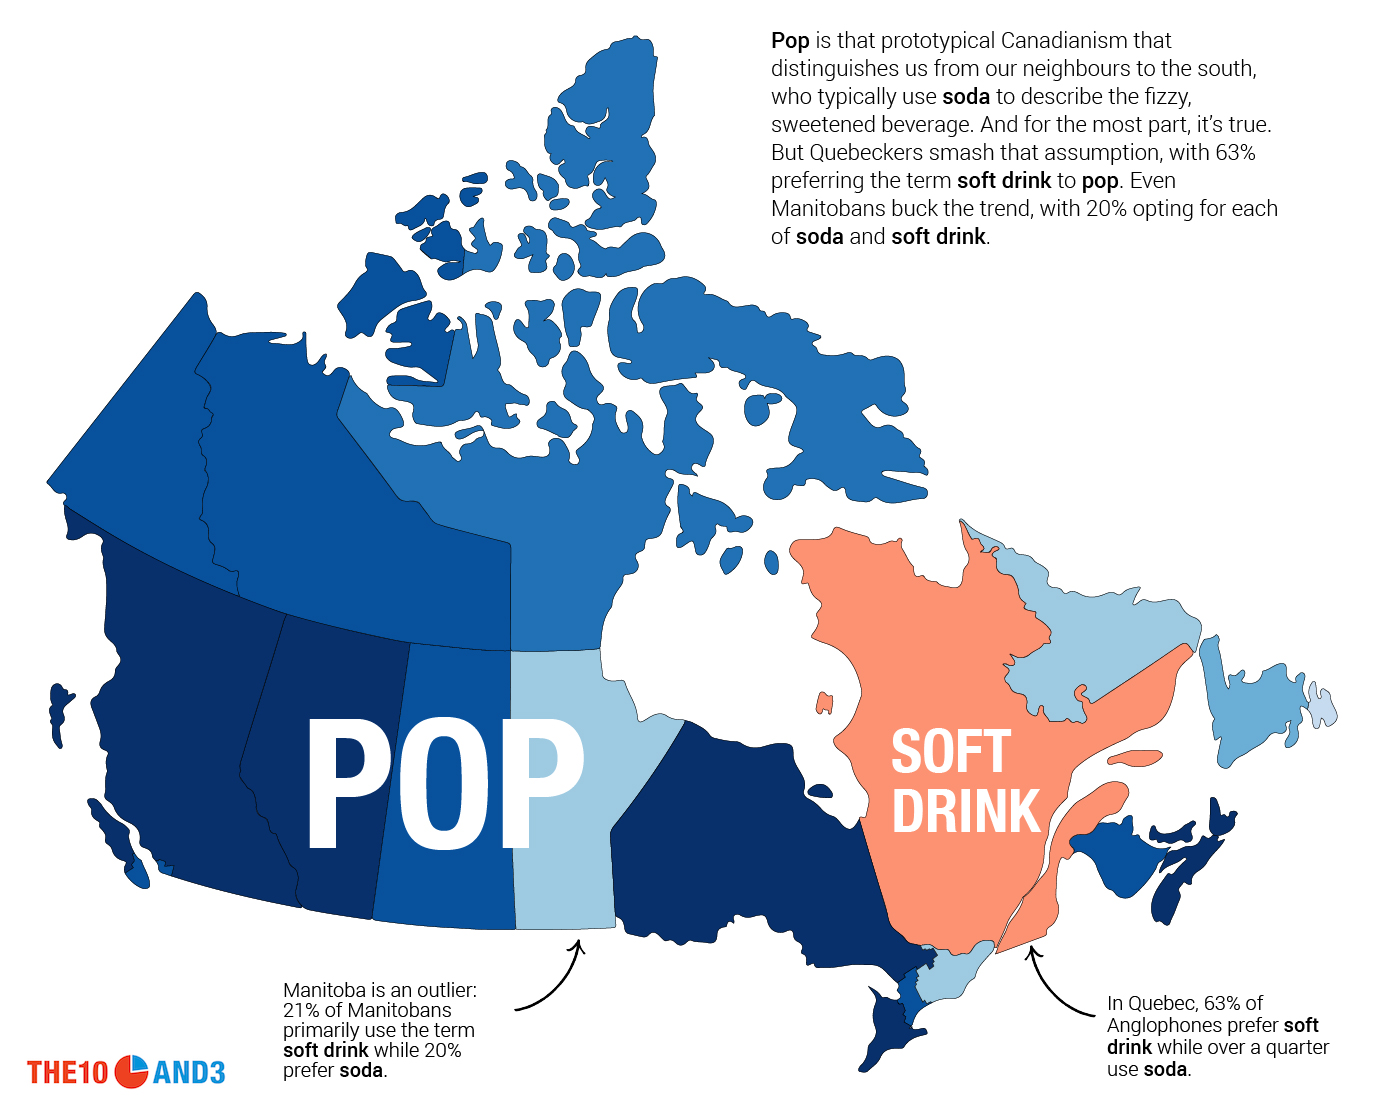
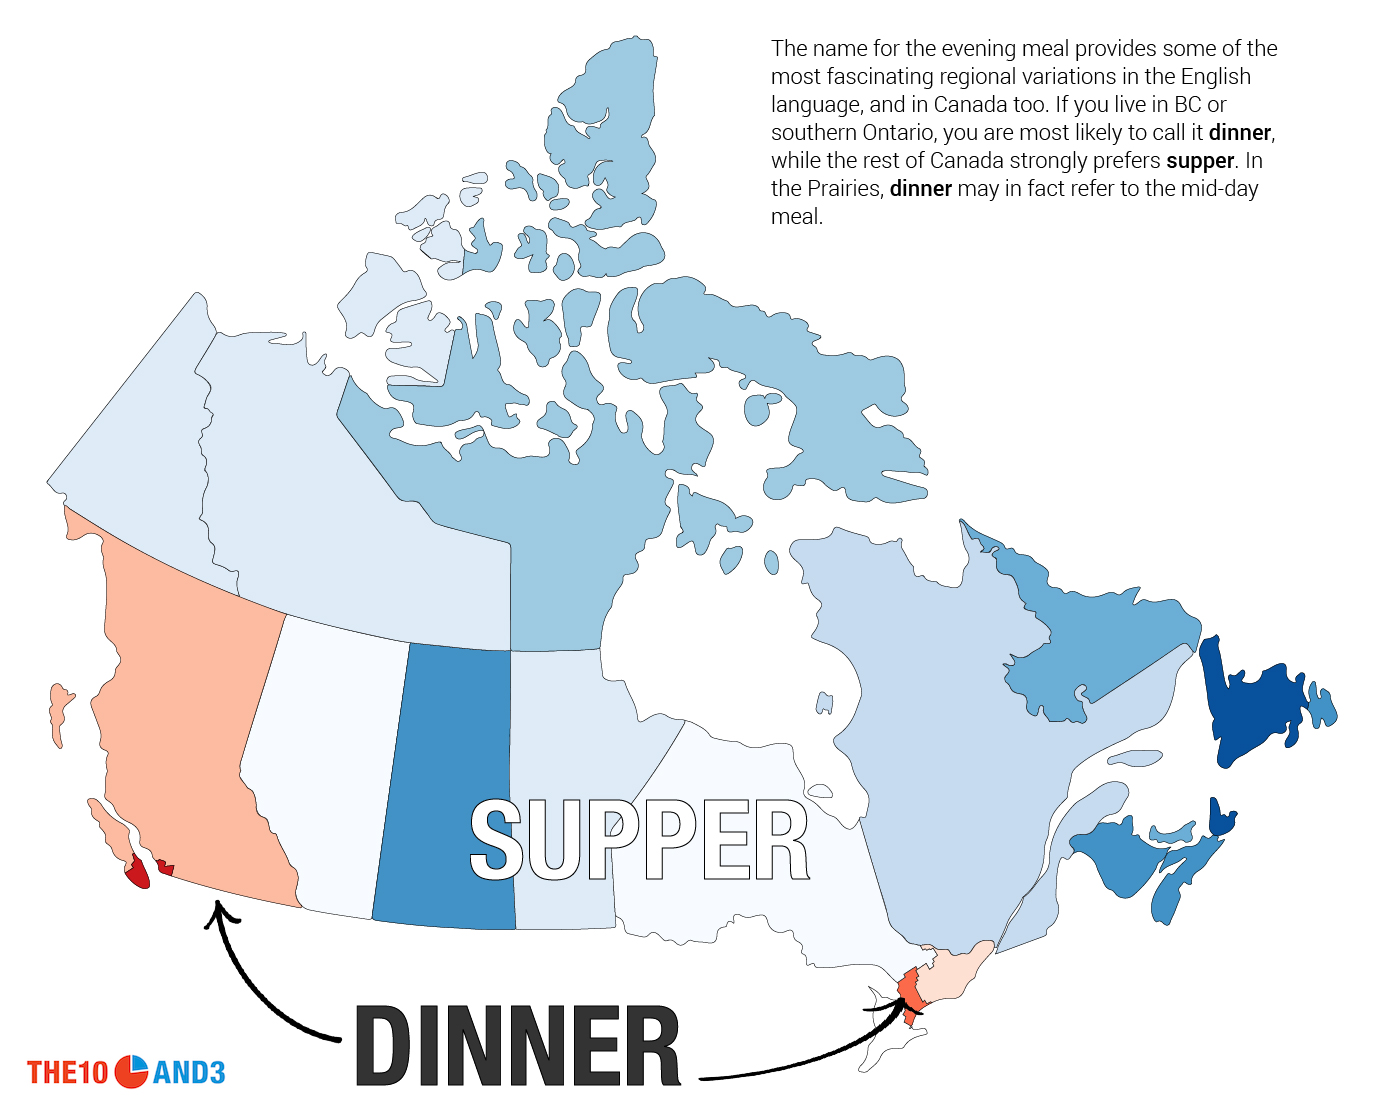
To understand the different ways that Canadians speak, we conducted an online survey of English-speaking Canadians, asking 35 questions about everything from what you call a carbonated, sugary beverage (pop vs soda vs soft drink) to the preferred term for an evening meal (the great supper vs dinner debate). We then mapped the results, revealing some stark and surprising linguistic patterns across the country. In the maps that follow, each colour represents a term or pronunciation being most dominant in that region, and the intensity of the colour corresponds to its level of dominance there. If a region has a white or very light colour, then there is no particularly dominant term in that place.

We collected over 9500 responses from across the country, including from every province and territory, as well as a significant number from interesting linguistic subregions like Cape Breton, Labrador and the Avalon Peninsula in Newfoundland. We also collected a significant number of responses from some of Canada’s most populous provinces, allowing us to study the differences between densely populated urban areas (like the Greater Toronto Area and southwestern BC) and more sparsely populated, rural areas (like Northern Ontario and the BC Interior). The maps show only Canadians who both grew up and currently reside in the same province or territory, which helps to isolate regional influences in language.

Canadianisms

Canada is known for some of its unique vocabulary, like chesterfield, toque, Kraft Dinner and even garburator. But how prevalent are these terms in reality, and what regions of the country embrace them most fully? Pop vs. Soft Drink

Toque vs. Hat


Pencil Crayons vs. Coloured Pencils vs. Leads


Garburator vs. Garbage Disposal


Kraft Dinner vs. Macaroni and Cheese


“Pylons


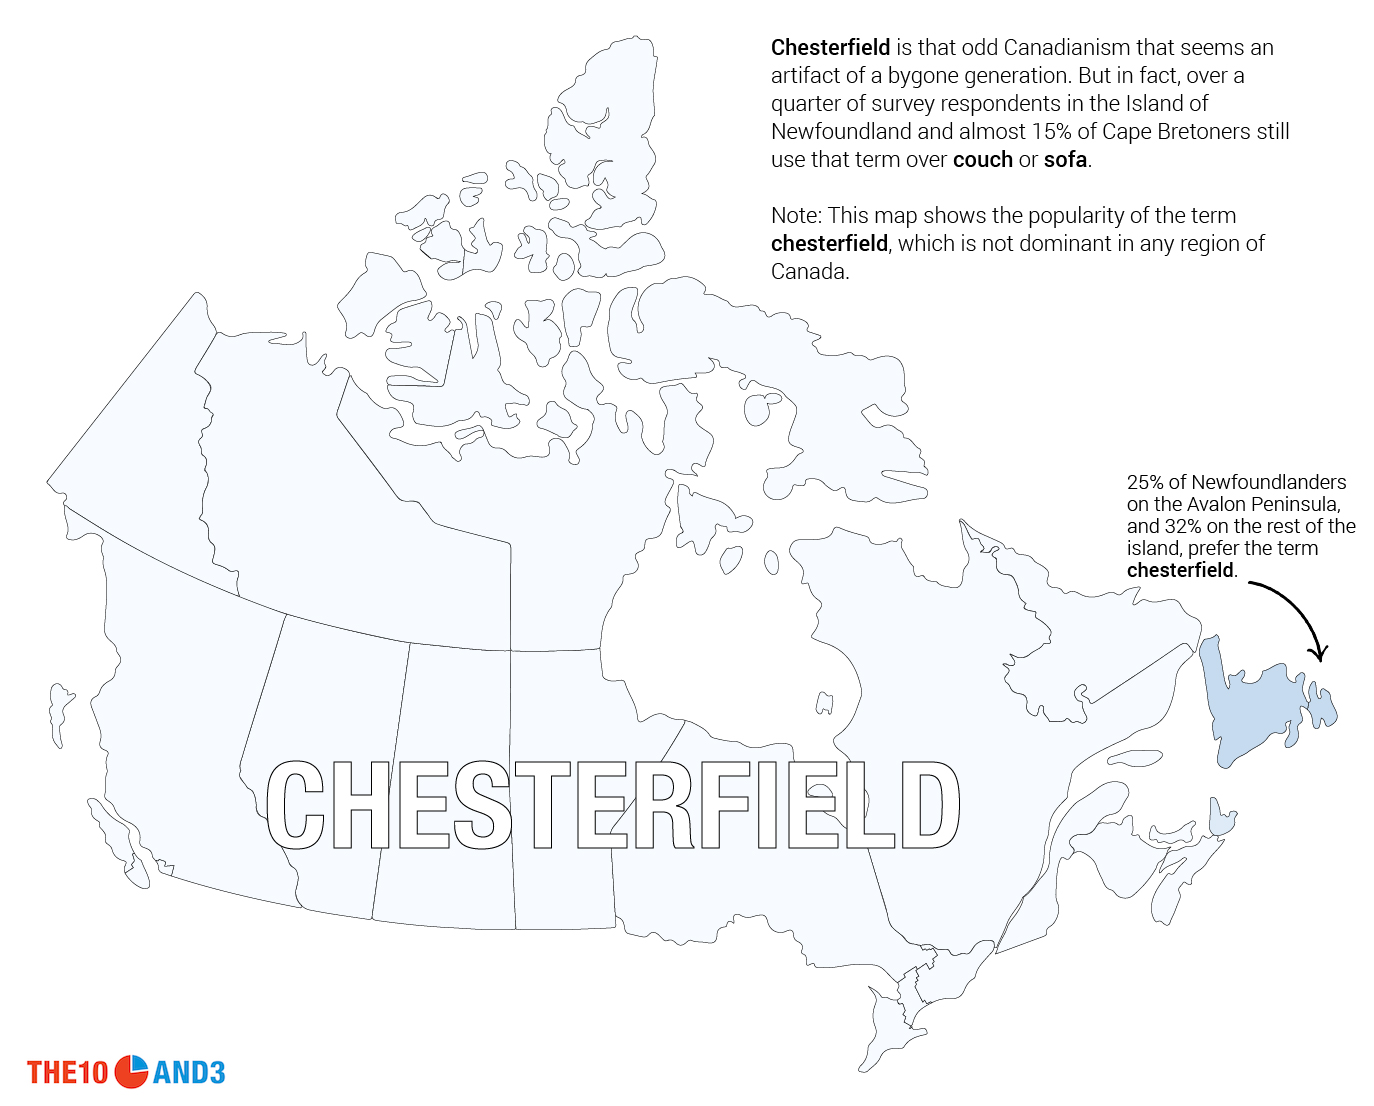
Popularity of Chesterfield

Strong regionalisms

It can be easy to forget how diverse Canada is in terms of culture, politics, and of course, language. In these survey questions, we learned that there are striking regional differences in the words we use to describe some of the simplest ideas. “Supper

Runners vs. Running Shoes vs. Sneakers


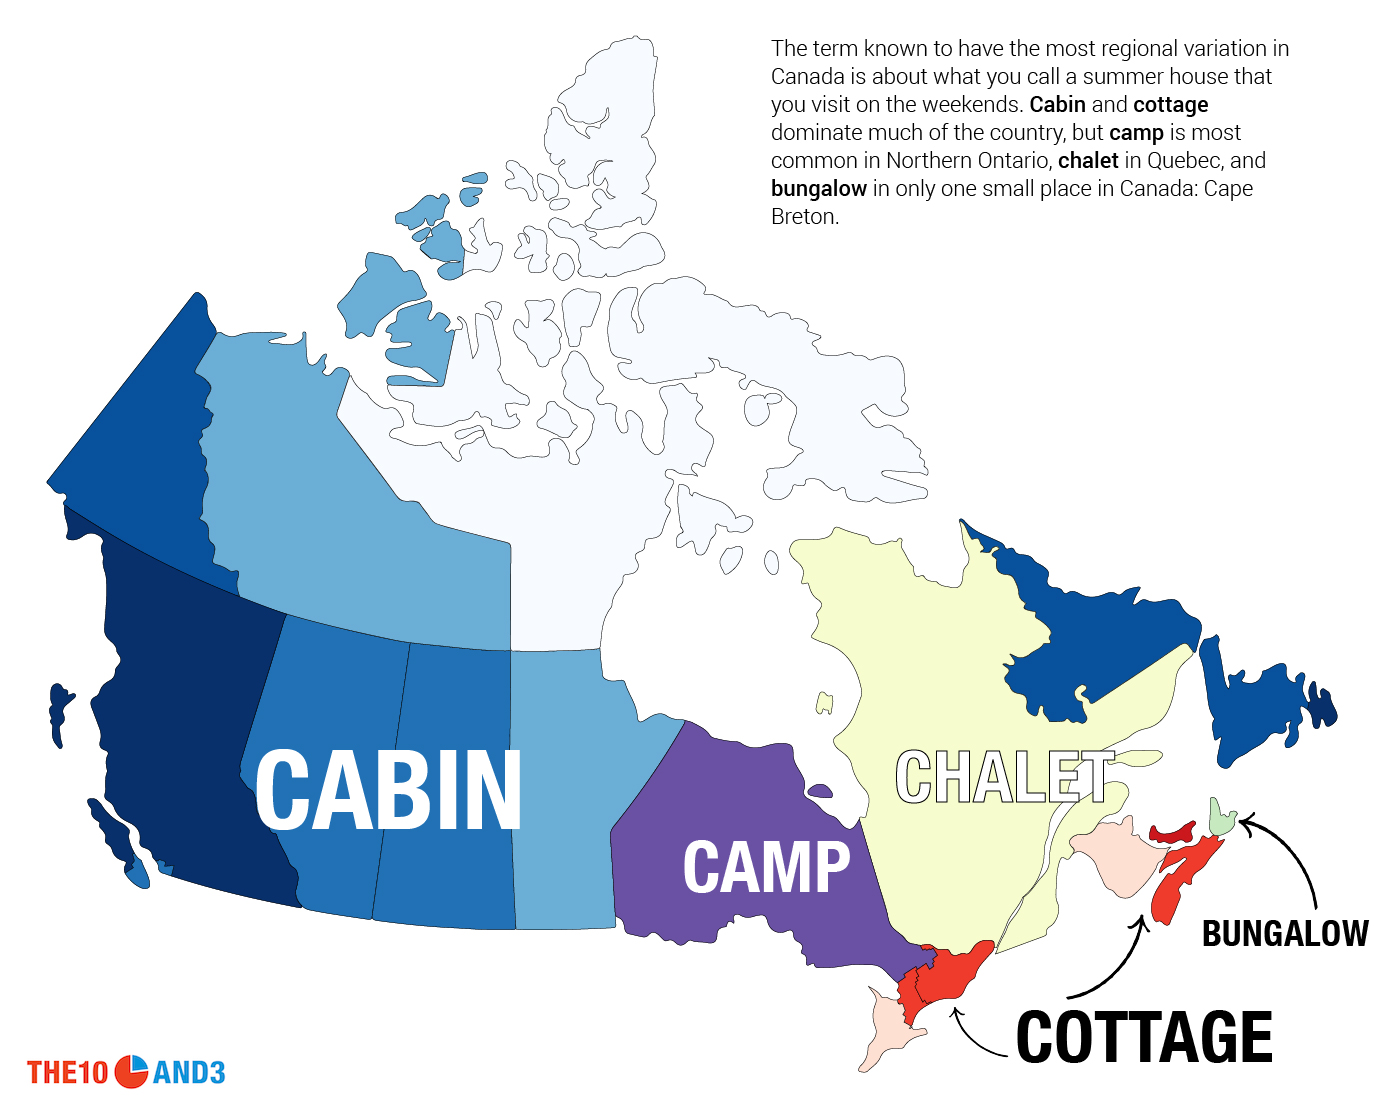
“Cabin


Hoodie vs. Bunnyhug


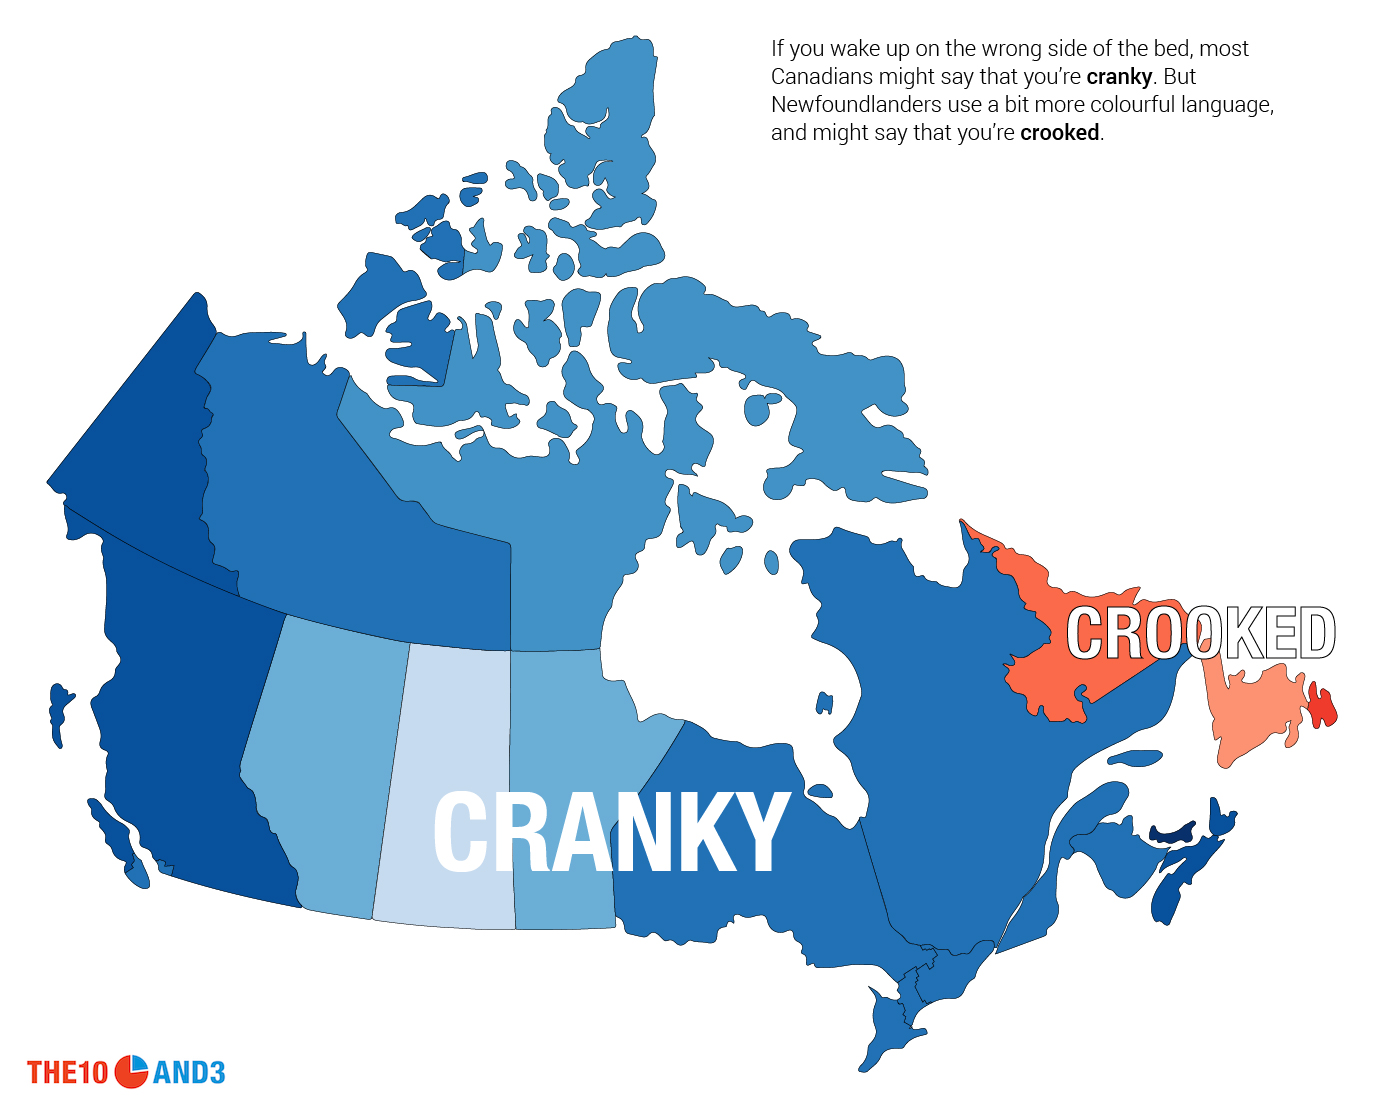
“Cranky


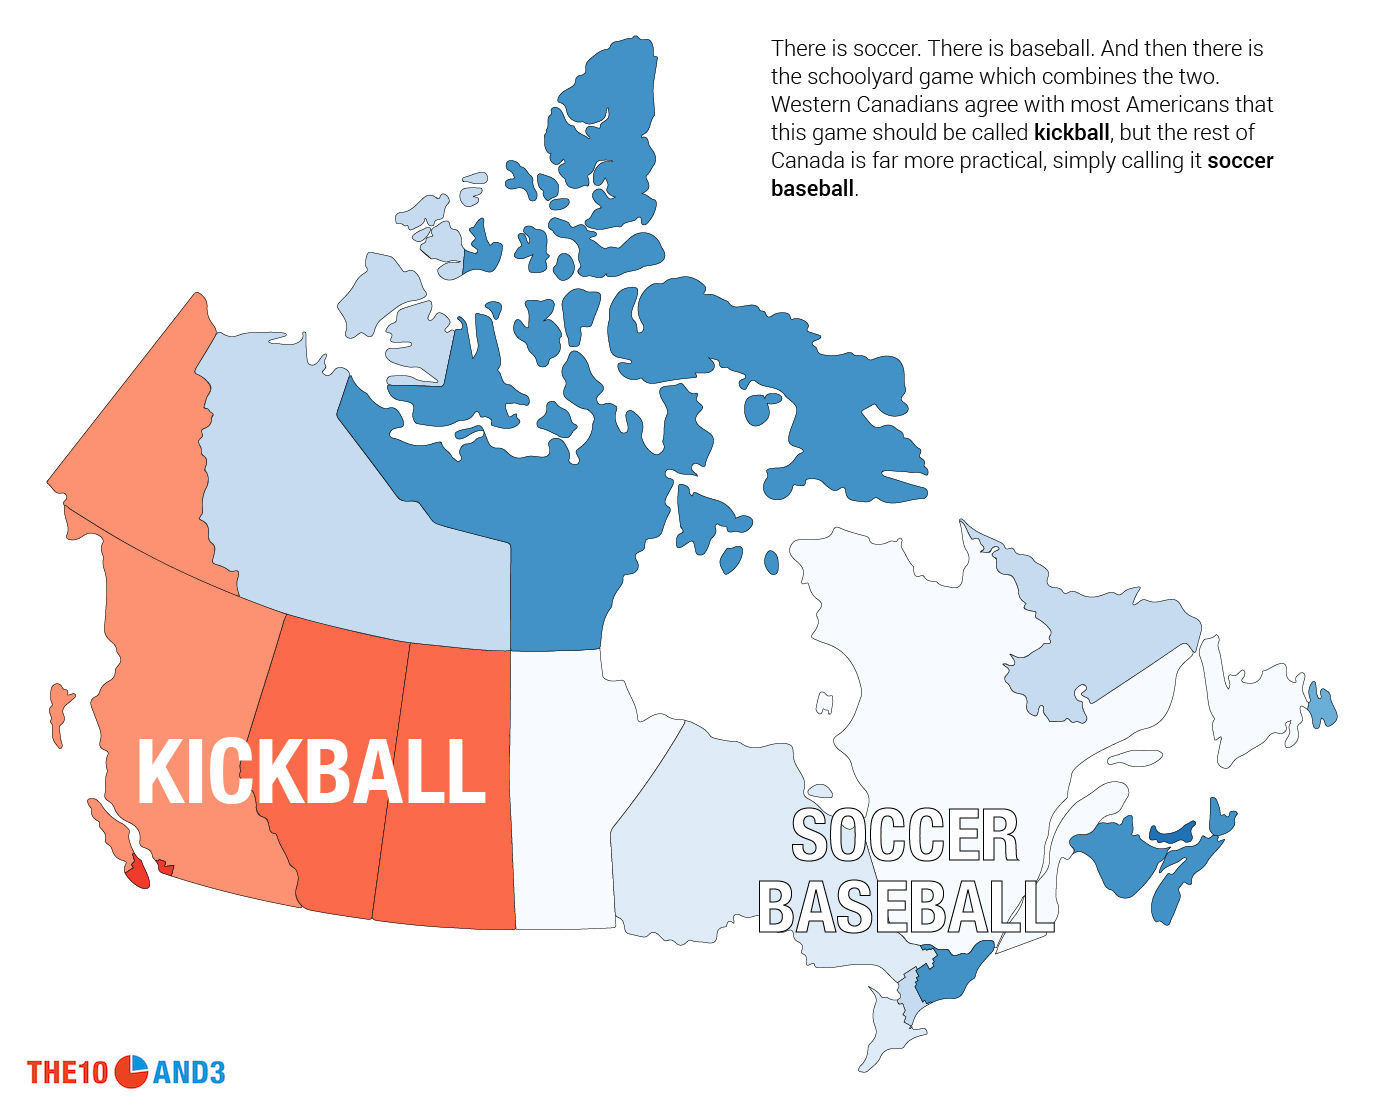
Kickball vs. Soccer Baseball


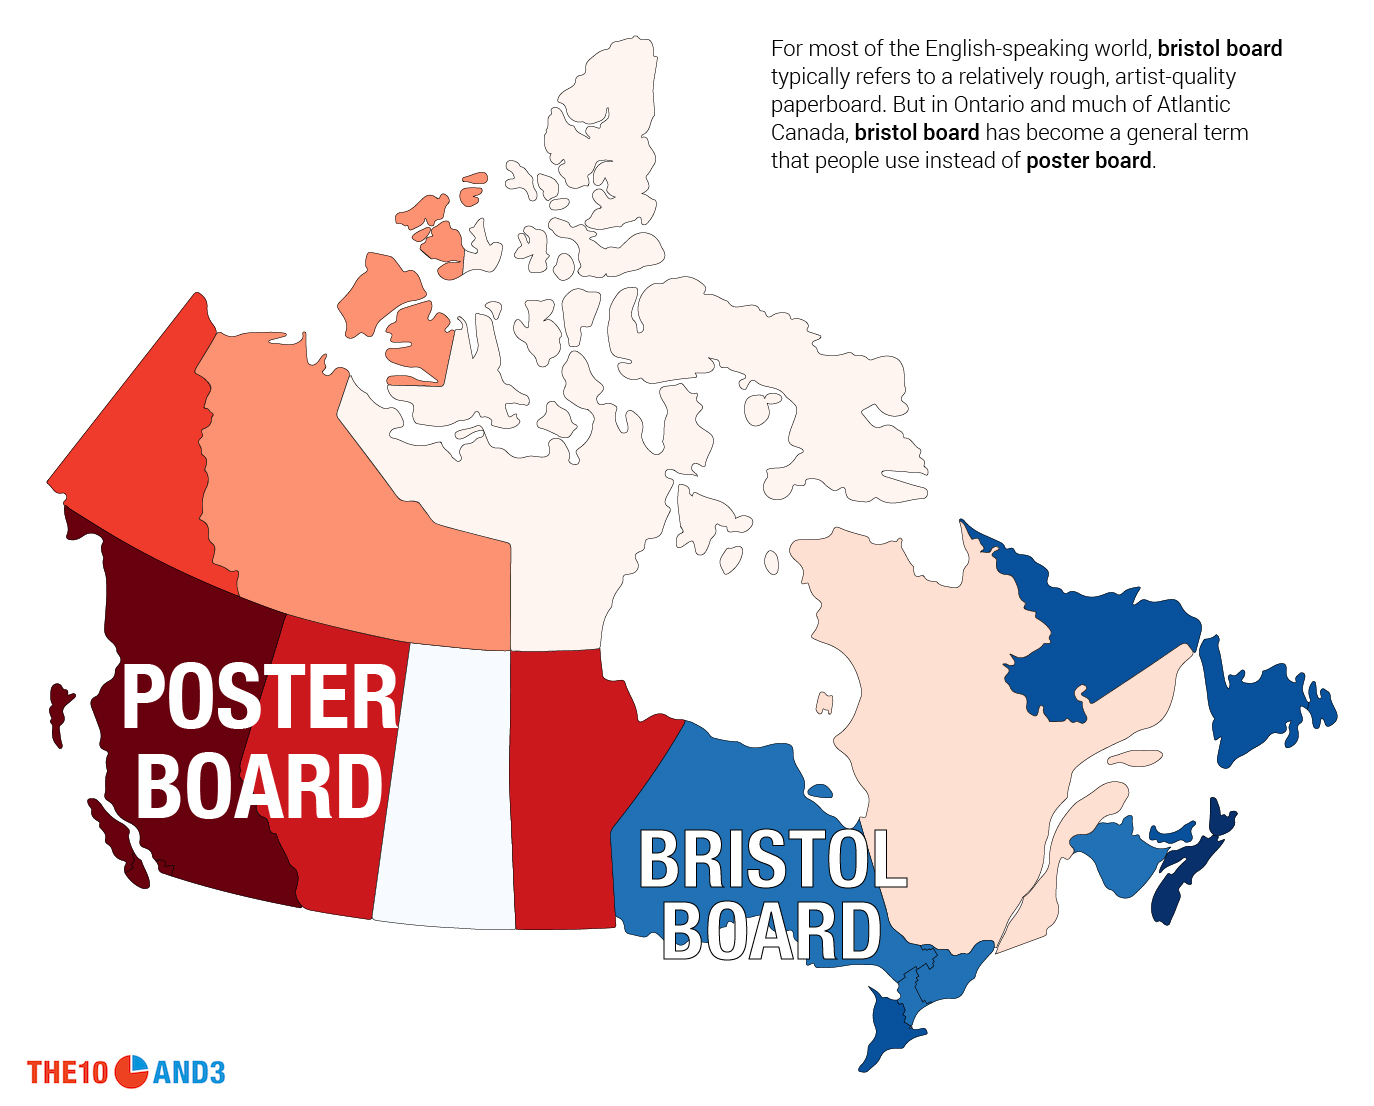
Poster Board vs. Bristol Board

How we pronounce

The Canadian accent is sometimes stereotypically boiled down to a single word: “aboot”. But there is of course so much more to it than that, and an incredible amount of regional diversity. We examined a few such terms in our survey, including the pronunciation of words like caramel, decal and even the city of Toronto. CARE-A-MEL vs. CAR-MEL
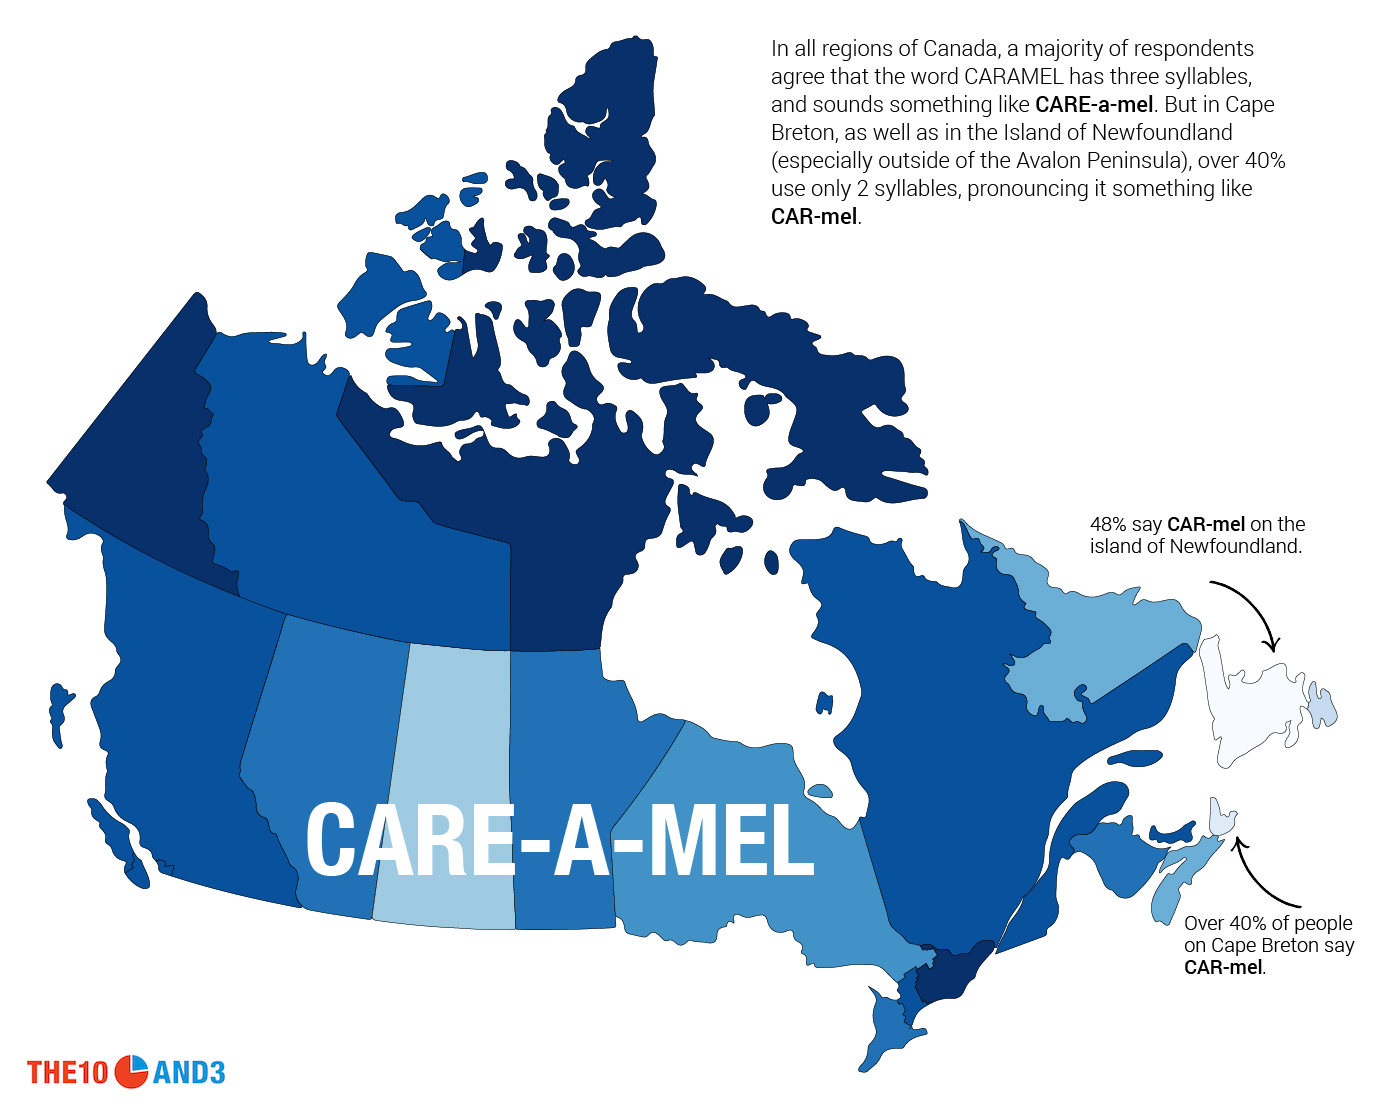

Deckle vs. Dee-cal


Toronto - Final

Some surprising differences

Moving past some of the most obvious differences in the way Canadians speak, we learned that there continue to be some fascinating but subtle regional trend that govern the way we call everything from our monthly utility bill to our dinner table tools. Cutlery vs. Utensils vs. Silverware
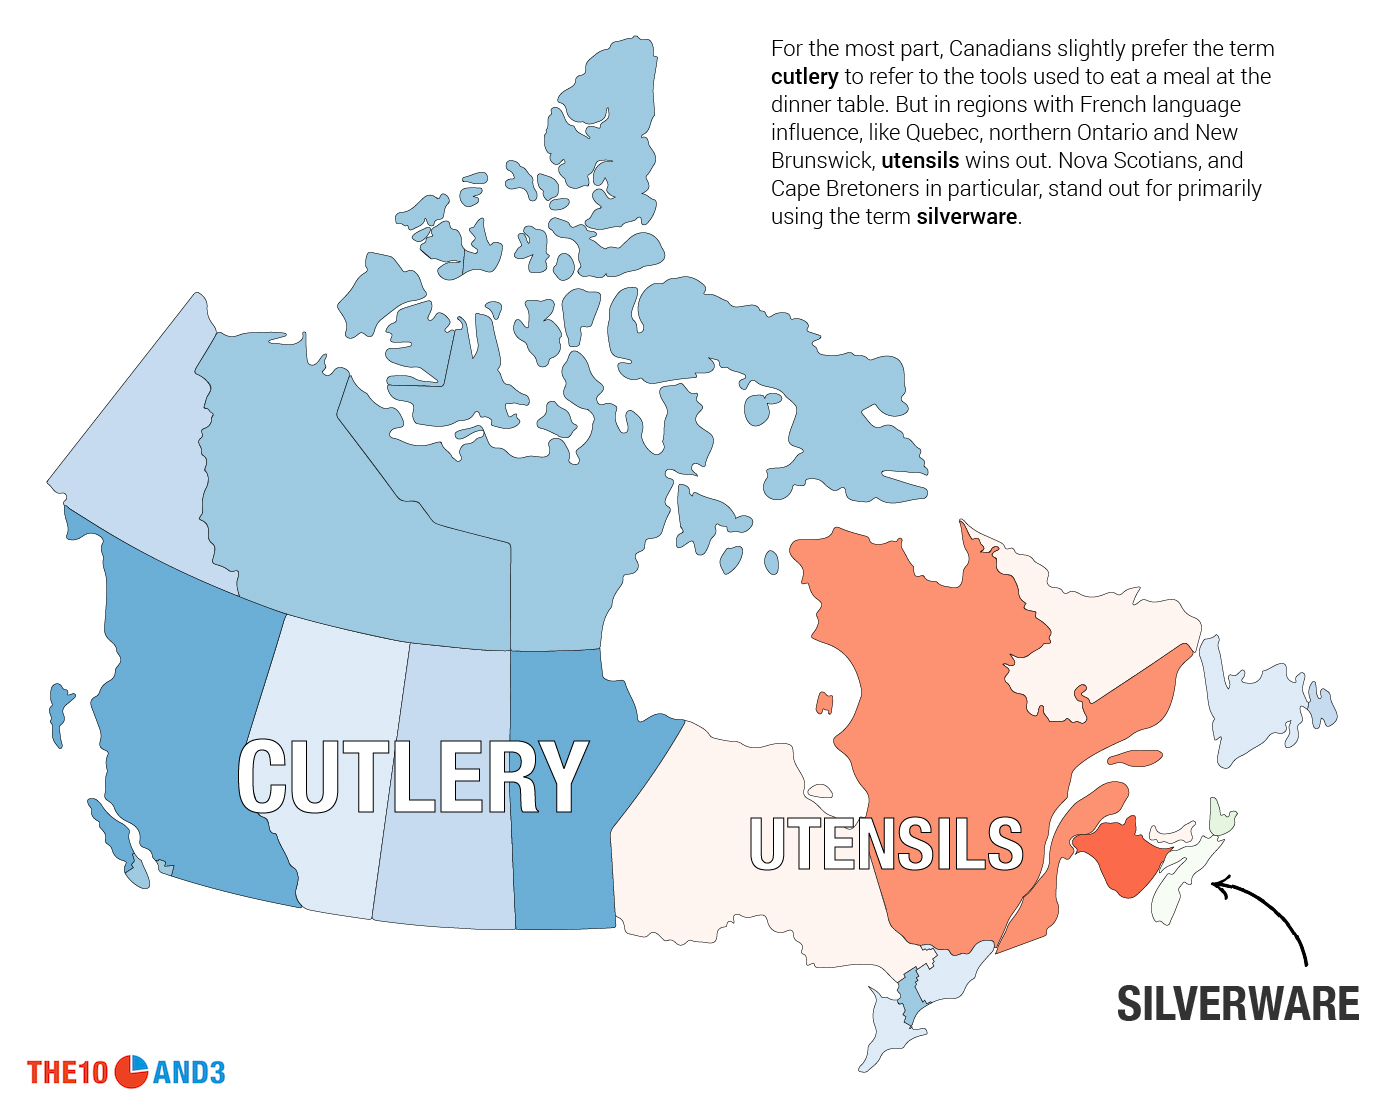

Grades vs. Marks


Electric Pill vs. Hydro Bill


Rain Gutters vs. Eavestroughs


“Rubber

Methodology and Discussion

We are grateful for Professor Charles Boberg’s help and guidance in reviewing our survey and providing insight and historical context into the patterns that we observed. Our study is of course not the first to examine the different ways that Canadians speak. But it is to our knowledge the largest recent national-level survey of Canadian English, covering Canada’s vast geographical scope and diversity, reaching a significant number of respondents from every province and territory, as well as important linguistic subregions in the country.

Our online survey was conducted primarily via social media over a month in June 2017, gathering over 9500 responses. In our mapping, we restricted only to respondents who both grew up and currently live in the same province. For provinces with subdivided regions like Ontario or Nova Scotia, we mapped according to the region where the respondent grew up. We had at least 25 respondents in every province and subregion, but had many hundreds of responses in almost all areas except the Territories.

While our survey method provided an efficient means of getting many responses, our survey respondents are not representative of all Canadians in the standard statistical sense. Respondents to our survey provided their age and education level, and in aggregate they tended to skew younger and more educated than the overall population. As a result, some questions may display certain kinds of biases; for instance, the term chesterfield is known to be more common among older Canadians, so our data likely underestimates the prevalence of this term as compared to couch or sofa.

Nevertheless, as our analysis primarily focuses on geographic distributions, we are confident that the observed trends are real and meaningful. Indeed, our survey results for some well-studied variables in the linguistics community, like the name of a lakeside summer home (cabin/cottage/camp), the name of the evening meal, and others, closely match previous results. Consequently, Boberg notes that this “… suggest[s] that they represent real patterns and not chance findings influenced by [our] particular method.”

Some questions for our survey were adapted from previously studied language variables in past studies and surveys – including Boberg’s influential North American Regional Vocabulary Survey – while others were drawn from our own research and observations. The most interesting results were presented in this article.

We began with a set of mapping divisions used in the North American Regional Vocabulary Survey; that is, each province is treated as a single linguistic unit, while also subdividing British Columbia into two regions — the southwest urban Vancouver/Victoria region, and the rest — and Ontario into four regions — southwestern Ontario, the Greater Toronto Area, eastern Ontario, and northern Ontario. We then added the three territories, as we had sufficient data for each, as well as several interesting linguistic regions that to our knowledge had not been fully studied in a pan-Canadian survey such as this: Cape Breton in Nova Scotia, Labrador, and the Avalon Peninsula in Newfoundland.
Don't miss our newest maps, charts and stories. Sign up now to have them delivered to your inbox.

Gord, Sheila, Graham and Beverley? The Most Distinctively Canadian Names Are Not What You’d Expect

Gord, Sheila, Graham, Beverley. To many, there is something about these names that is as familiar and quintessentially Canadian as the words chesterfield and poutine.

Is it that these names really are so common in Canada, with our high school yearbooks bursting at the seams with Gords and Sheilas? Or is that they just represent silly stereotypes, made famous by a few celebrities or CBC characters, and have now become lodged in our collective Canadian consciousness?

We dug into the historical birth records to determine, according to the data, what are truly the most distinctively Canadian first names. What we discovered certainly confirms some of these long-standing stereotypes, yet also reveals a surprising glimpse into the waves of immigration that have continually redefined what it means to be Canadian. While names like Lorne, Archibald and Gwendoline were typical of the 1920s and 1930s, by the middle of the century, these British and Germanic monikers gave way to Italian names like Vincenzo, Giuseppina and Antonietta. By the 21st century, given names like Zainab, Armaan and Gurleen, which would have sounded altogether foreign to the Canada of yesteryear, have come to define the new Canadian identity.

What we did

We realized that just because a name is popular in Canada, that doesn’t make it distinctively Canadian. Names like Liam and Noah for boys and Sophia and Olivia for girls are the most popular baby names in this country, but they are just as common in the US. So instead, we called a name distinctly Canadian if it appears at a much higher rate in Canada than it does in our culturally similar neighbour, the United States. We called this ratio of the Canadian name rate to the American rate, the Canadian factor of a name. This means, for instance, that you’re much more likely to bump into a person with a high Canadian factor name while walking the streets of Toronto or Calgary than New York or Dallas.

We looked at birth data stretching back to the 1920s, and focused on the provinces of English Canada because (i) Quebec doesn’t provide comprehensive name data to the public and (ii) it is less compelling and clear that names in Quebec should be compared to those in, say, the United States or even France.

Finally, note that we did choose to include French Canadian names in our results, as long as they are common in provinces outside of Quebec.

The Names

Names marked with an asterisk (*) have multiple common spellings, like Graeme/Graham and Chantal/Chantel/Chantelle.

In the early part of the 20th century, being Canadian most likely meant having roots in Great Britain, as a result of the Great Migration to Canada in the early 19th century and further waves of immigration from the British Isles. Consequently, the most Canadian names of the 1920s, 30s and even 40s have a distinctly British flavour, featuring female names like Gwendoline, Georgina, Beverley and Lilian, and male names like Ian, Angus, Colin and Graham.

However, the name Lorne stands out as being particularly Canadian, coming in at over 100 times more common in Canada than in the United States. Famous Canadians like actor Lorne Greene (b. 1915) and Saturday Night Live creator Lorne Michaels (b. 1944) can most likely attribute their naming to the popularity of British nobleman the Marquess of Lorne, who served as Governor General of Canada from 1878 to 1883.

By the 1950s and 1960s, however, the effects of new waves of European immigration were felt in how Canadians were named. Italian immigrants, who were comfortable giving their children names from the motherland while still assimilating culturally to their new country, strongly influenced Canada’s naming trends. Among males, Giuseppe, Paolo and Franco dominate the list, while among females the names Giuseppina, Antonietta and Giovanna became distinctly Canadian-sounding first names.

Giuseppina, specifically, has an intriguing and very Canadian backstory. In 1960, a documentary film by that name was released in Britain, featuring a charming young character called Giuseppina. The film later won an Oscar for best short documentary, and moreover, the BBC soon came to use the movie as a trade test colour film, broadcasting it more than 180 times over the next decade. The film’s success and prominence on BBC (a channel whose programs were frequently rebroadcast on Canadian television) no doubt made Giuseppina a much more popular name in Canada than in the United States.

By the late 20th century, the Canadian factor ratios that we compute rarely rise above 10 or 15, suggesting that naming trends in Canada have more closely converged with the United States, and so very few first names in this generation deserve to be classified as distinctly Canadian. This is particularly true among female names, where the relative popularity of top-ranked Kimberley, Chantal and Gillian fail to approach the wildly distinctive heights of the female names of earlier years. On the other hand, among males, the names Darcy and Graham (also spelled Graeme) became extremely common in Canada relative to our American neighbours. Athletes like hockey player Darcy Tucker (b. 1975) and golfer Graham DeLaet (b. 1982) are examples of this naming trend. At the same time, French names Luc, Stephane and Mathieu, which turned out to be quite common outside of Quebec, also help define a generation of men born in the 1970s and 80s.

While the new millennium in Canada did not produce a bounty of extraordinarily Canadian-sounding names (almost no names have a Canadian factor above 20), there is a distinct introduction of South Asian names which have increasingly begun to define the national identity. Punjabi names like Gurleen, Harleen and Jasleen, which were especially popular in the 2000s in British Columbia, began sounding increasingly Canadian, while other South Asian names like Simran, Zahra and Armaan also started to appear. Middle Eastern names such as Syed, Muhammad and Zainab began to make their way into the list as well.

Perhaps, as we observe with the deluge and then quick retreat of Italian names of the 50s and 60s, children of today’s South Asian immigrants will revert to more “traditional” Canadian names once they have children of their own. And then the next wave of immigrants to Canada will once again redefine what it means to have a Canadian name.

Methodology

We collected Canadian baby name data from the Ontario, British Columbia and Nova Scotia, as well as the United States, stretching back to 1920 through 2013; Alberta data went back to 1980. Other provinces and territories do not publicly provide detailed name data (though several provide less useful top 10 or top 100 lists, which we did not use). The provinces we include represent over 75% of the population of English Canada. In each dataset, the count of every single given name is provided per year as long as it occurred at least five times that year.

For each decade, we computed the Canadian factor of each name by calculating the rate that the name occurs in Canada (or more specifically, those four provinces) divided by the rate that it occurs in the United States. Importantly, we restricted our analysis to names that occur in at least 0.05% of births for that gender in Canada, which allows us to ignore names that are really quite rare but just happen to be more common in Canada than the US. For example, is a name that occurs a handful of times in Canada per year, but never in the US, really a distinctly Canadian name? We think no. Consequently, this restriction ignores any name that occurs fewer than approximately 500 times per decade in Canada.

You might be wondering, how can the name Gordon not be more prominent in the data? In many ways, Gordon is the most quintessential Canadian boys name out there, represented by folk heroes like hockey star Gordie Howe, musicians Gordon Lightfoot and Gord Downie, and actor Gordon Pinsent. We were surprised too, but our answer is simple: the data doesn’t lie. The name was indeed popular in the 1920s and 1930s, just not popular enough, and more importantly, not distinctly popular enough relative to the US, to merit higher rankings. There goes conventional wisdom!

Don’t miss our newest stories! Follow The 10 and 3 on Facebook or Twitter for the latest made-in-Canada maps and visualizations.

Don't miss our newest maps, charts and stories. Sign up now to have them delivered to your inbox.

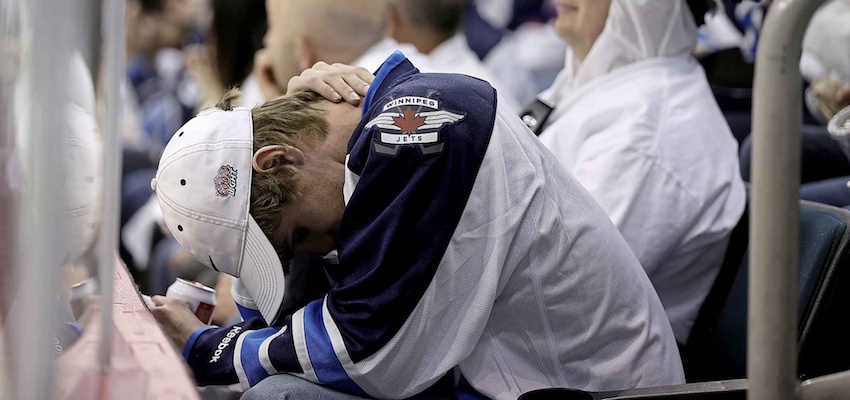
Winnipeg Jets Fan Misery

The Most Miserable Sports City – 2018 Edition

Sports curses have been dropping like flies in recent years. First it was the Cleveland Cavaliers, who exorcised their city’s sports demons with a dramatic come-from-behind series win in 2016 against the seemingly unstoppable Golden State Warriors. Later that year, it was the Chicago Cubs — perhaps the most sad-sack sports franchise of the 20th century — who razed the Curse of the Billy Goat in a heartstopping World Series victory. After them came the Houston Astros, who had never won a World Series since being formed in the early 1960s.  Soon after, the Philadelphia Eagles swept away the Lombardi Curse — and the mighty New England Patriots — in winning the 2018 Super Bowl.

But if you thought there was no more sports misery left in this world, you’d be sadly mistaken. Fans in last year’s top two cities, Buffalo and Cincinnati, still have very little to cheer for, and pro athletes in a host of other North American cities continue to crush their residents’ championship dreams.

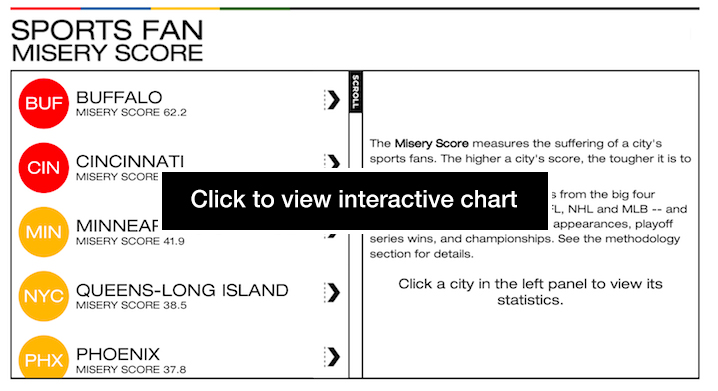
Click on a city name to see the playoff history of its sports teams.

Use the SCROLL UP and SCROLL DOWN buttons to explore the complete list of cities.

This year, we’ve expanded our rankings beyond the Big Four leagues (NFL, MLB, NBA, NHL) to recognize both the growing presence and excitement around Major League Soccer, as well as the die-hard fandom of the Canadian Football League. These changes allowed us to crown a new, sad champion this year: Winnipeg! As in our previous rankings (2017, 2016, 2015), we weighted playoff appearances, playoff series wins and championships when calculating a city’s Misery Score. Examining every city with at least two franchises, we relied heavily on recent success (but excluding this year’s ongoing NHL and NBA playoffs).

Finally, after many thoughtful comments from readers, we’ve adjusted our formula so that sports teams within a city are not all treated the same way, since some franchises can be much more (or less) popular depending on the city. We recognize that, for instance, the Minnesota Vikings are first in the minds of most residents of Minneapolis-St. Paul, while the MLS’ Minnesota United FC or even the NBA’s Timberwolves are less vital in the city’s sports psyche. See the Appendix for details on our scoring system, weights and city clustering choices.

Winnipeg

First off, we wish to apologize to the miserable sports fans from the ‘Peg for ignoring them until this year. Expanding our dataset to the CFL has opened us up to a brand new world of suffering north of the border. But crowning Winnipeg as this year’s champion comes with a major caveat: this year’s Winnipeg Jets are actually very good. A deep playoff run (or, lest we jinx things, a Stanley Cup?) could erase years of sports-induced trauma for Winnipeg’s denizens, and cause a tumble down our misery rankings.

But back to the team’s historical misery. In 1996, hockey-mad Winnipeg fans suffered what is perhaps the ultimate insult: losing their cherished Jets franchise to Phoenix, a Sun Belt city with no hockey tradition and a fan base that could hardly tell an offside from an interference call (they’re still learning the ins and outs of the game). The Jets did make a triumphant return in 2011 after the Atlanta Thrashers relocated north and adopted Winnipeg’s traditional hockey team name. Of course the city has never celebrated a Stanley Cup victory, and their last playoff series victory head been way back in…1987.

The Blue Bombers, Winnipeg’s blue and gold CFL franchise, is truly a model of how not to succeed in a small market city. The Bombers have by far the longest Grey Cup drought of any team in the CFL, stretching back almost 30 years. This may not seem like particularly long from the perspective of patient fans in Cleveland, Toronto or Chicago, until you remember that the CFL has only nine teams, with nearly all of them qualifying for the playoffs each year. In a league that small, the Blue Bombers should have won simply by chance in this stretch of 28 years, but Bombers fans continue to maintain their stiff upper lip through years of poor coaching and even worse management, waiting patiently for their Bombers to break through.

Cincinnati

Sports fans in the Queen City are a truly miserable bunch, with their only advantage over the more miserable fans in Winnipeg being that the Reds have actually won a championship since the fall of the Berlin Wall.

The Reds have continued to be mostly terrible through the 90s, the 00s and deep into this century’s second decade. Besides their lacklustre play on the field, the Reds are almost as well known for their mess in the front office as well. While Houston Texans owner Bob McNair may have simply compared his players to prison inmates, longtime former Reds owner Marge Schott took the caricature of evil sports owner to the next level, being known for her racist comments toward African-Americans, Asian-Americans and Jews, and open praise for Adolf Hitler. On the baseball front, her ever-present St. Bernards were known to frequently relieve themselves on the field of Riverfront Stadium, while her distaste for scouts made it difficult for the Reds to develop into a more successful baseball club.

In football, the Bengals have never won a Super Bowl, and have subjected their fans to humiliating defeats in their past seven playoff games (that’s 28 years without a playoff game win). Only Cleveland’s Browns are a sadder NFL franchise. But at least Cincinnati’s Ohio neighbors to the northeast tasted a championship with the Cavs. No such luck for Cincinnati.

Buffalo

Buffalo achieved the pinnacle of misery last year, gaining the top spot in our rankings, so the city has seen some progress. Yes, the Buffalo Bills did make the playoffs last year, after an almost 20-year drought. But they were quickly dispatched by the Jacksonville Jaguars in the Wild Card Playoffs, and that was that. Memories of the Bills’ four straight (losing) trips to the Super Bowl in the early 1990s are starting to feel like the good-old days, and it will take much more than a 9-7 season to get Bills fans feeling good again.

The Sabres, one of hockey’s least successful franchises of the past decade, appear to actually be getting worse, coming in dead-last in the NHL this season by a wide margin. At this point, it would take Pat LaFontaine coming out of retirement to pull the Sabres out of their misery. The city remains without a championship in either the NFL or the NHL, and no reasonable prognosticator would expect this to change in the next few years.

Detroit

Detroit may at first seem a somewhat unusual choice to be in the top 5 most miserable sports cities in North America. After all, the Red Wings — until recently — have been one of the NHL’s most consistently successful franchises, appearing in 25 straight postseasons through 2015-16, while the Detroit Pistons were also a strong NBA franchise in the last decade.

Nevertheless, our data suggests that Detroit fans care most about their baseball (Tigers) and football (Lions) teams, both of which have caused nothing but sorrow for their loyal fans. The Tigers last won a World Series in 1984, but gave their fans some hope starting in 2005 with a strong (and expensive) free agent push led by owner and Detroit native Mike Ilitch. Expensive signings of players like Pudge Rodriguez, Magglio Ordonez and Prince Fielder led to a decade of success along with two World Series appearances, but the team could never get over the top and win an elusive championship.

The story of the Lions is even less positive. The team has failed to win a playoff game since 1991 (a 38-6 stomping of the Cowboys, for those Lions fans with long memories), and have the ignominious honor of a winless season in 2008. The Lions’ many poor drafting decisions over the years have kept the team at a standstill, and so the future does not look particularly bright for the pride of the Motor City.

Queen’s-Long Island

New York City’s “little brother” teams — the Jets, Mets and Islanders, who share a historical fan base in Queens and Long Island — have not been the worst teams in their respective sports, but it seems like one-step-forward, two-steps-back for the whole bunch. The Mets appeared to be growing into a formidable club in the National League, with an ace pitching staff that includes Noah Syndergaard, Matt Harvey and Jacob deGrom, but 2017 was a huge disappointment, as the team was ravaged by injuries and a series of questionable trades. The New York Islanders have at times looked resurgent under the leadership of superstar captain John Tavares, winning their first playoff series (in 2015) in over two decades, but Tavares may be on the way out, and the team appears heading in the wrong direction. The Jets, in the post-Rex Ryan era, had a breakout 2015, but followed it up in the next two seasons with abysmal records.

With a 32-year championship drought, the most of any major sports city, New York’s proud little brother fans will continue their long, painful wait for sports glory.

Methodology Notes

Cities with Multiple Teams

Several large cities in North America have more than one professional team in the same league. To handle these cases, we divided fans up into natural allegiances, and calculated separate misery scores for each set of fans. Chicago is an easy one: one set of fans supports the Cubs (Chicago A), while the other supports the White Sox (Chicago B). Los Angeles is similar, with those supporting the Clippers (Los Angeles A) and those supporting the Lakers (Los Angeles B); LA’s two soccer teams were distributed based on geography, with the new Los Angeles FC playing on the same site as the Clippers’ former arena, and the flashy Galaxy joining the Lakers grouping.

The San Francisco Bay Area has two football teams and two baseball teams (and a single basketball and hockey team). Those in the East Bay typically back the Raiders and Athletics (San Francisco Bay Area A), and those in San Francisco and the peninsula back the 49ers and Giants (San Francisco Bay Area B). 

Then, there is the complexity of New York City. There are of course many exceptions to the clustering that we selected, but generally speaking, we have the “big brother” and “little brother” teams of New York. The Rangers and Knicks (who both play in Madison Square Gardens), along with the Yankees and Giants, have a somewhat consistent fan base. Similarly, the Jets and Mets (who shared Shea Stadium in Queens), along with the New York Islanders (who are originally from neighboring Long Island), tend to share fans based on geography and a common history (Queens-Long Island). 

The Misery Score Explained

We first compute a misery score for each team, as follows: a team gets a demerit point for each year since (i) it last made the playoffs, (ii) it last won a playoff series (which doesn’t include MLB play-in game wins), and (iii) it last won a championship. We cap each of the three above point values at 30, because the average fan’s age in the major sports is approximately between 42 and 43, and the age of 12 or 13 is the general age of enlightenment when fans start to really understand sports (and the misery that comes with losing). These points are added together, which gives each team a number of points between 0 (if the team won a championship last season) and 90 (if the team hasn’t made the playoffs in the past 30 years); we then normalize these values onto the [0,100] scale, to get a team-level misery score.

Finally, for each city, we combine the scores by weighting each team’s importance to that city’s fans. This isn’t an easy thing to calculate, or even know, but we used a technique adapted from FiveThirtyEight where we calculate a team’s importance to the city via Google Search traffic in that team’s state/province over the past five years. Naturally, MLS teams end up with a much lower weight than teams from other sports, as do CFL teams when compared to their hockey counterparts. Generally, NFL teams tend to have the highest weights, followed by MLB teams, but this trend isn’t universal, with the Royals being the heavyweights in Kansas City, and the Golden State Warriors in the San Francisco Bay Area.

For ease of interpretability, we bucket these city scores into 4 categories: green (0-15), yellow (15-30), orange (30-45) and red (45+). Green means that you only need to look back, on average, about 5 years to see a lot of success (Boston); yellow look back 10 years (Indianapolis), orange look back 15 years (Tampa Bay), and red over 15 years (Buffalo and Cincinnati).

Note that we have only chosen to display NFL champions since the first Super Bowl (in 1967). Teams with their last win prior to that (ex. Detroit) are marked as “NA” in our graphic.

Don't miss our newest maps, charts and stories. Sign up now to have them delivered to your inbox.

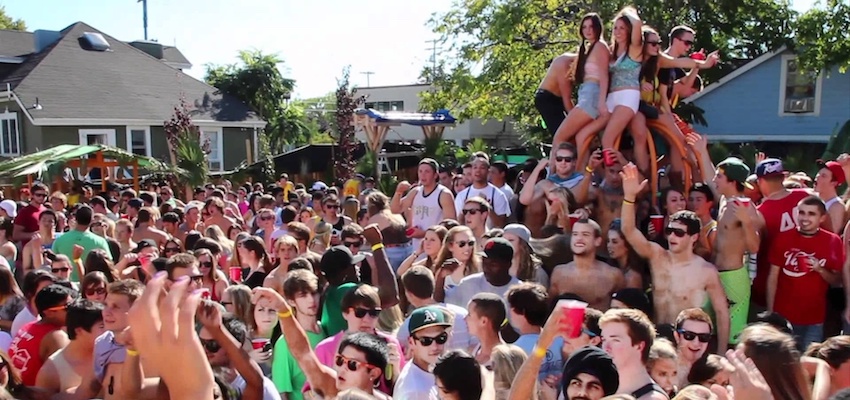
Party School

If Only Our Professors Could See How Much We Work On Weekends

My alma mater, Western University, has a reputation as a party school. In 2011, Western famously made Playboy’s list of Top 10 Party Schools in North America, the only Canadian university to achieve the honour. Cited for its rowdy dorm parties and hopping bar scene, Playboy’s stamp of approval has given Western an untouchable social reputation across the country.

A few years on, Maclean’s began surveying students on their social and work habits. Students who participate in the survey self-report how many hours they spend studying and partying in a typical week. Looking at partying data alone, Maclean’s crowned St. Francis Xavier the clear winner —  its students are well ahead of the competition in terms of hours partied — with Western University far down the list.

So what does a deeper look at the data tell us about Western’s reputation as a bastion of hedonistic student life, and how well do other Canadian universities deserve the not-so-coveted label of party school?

The time cost of partying

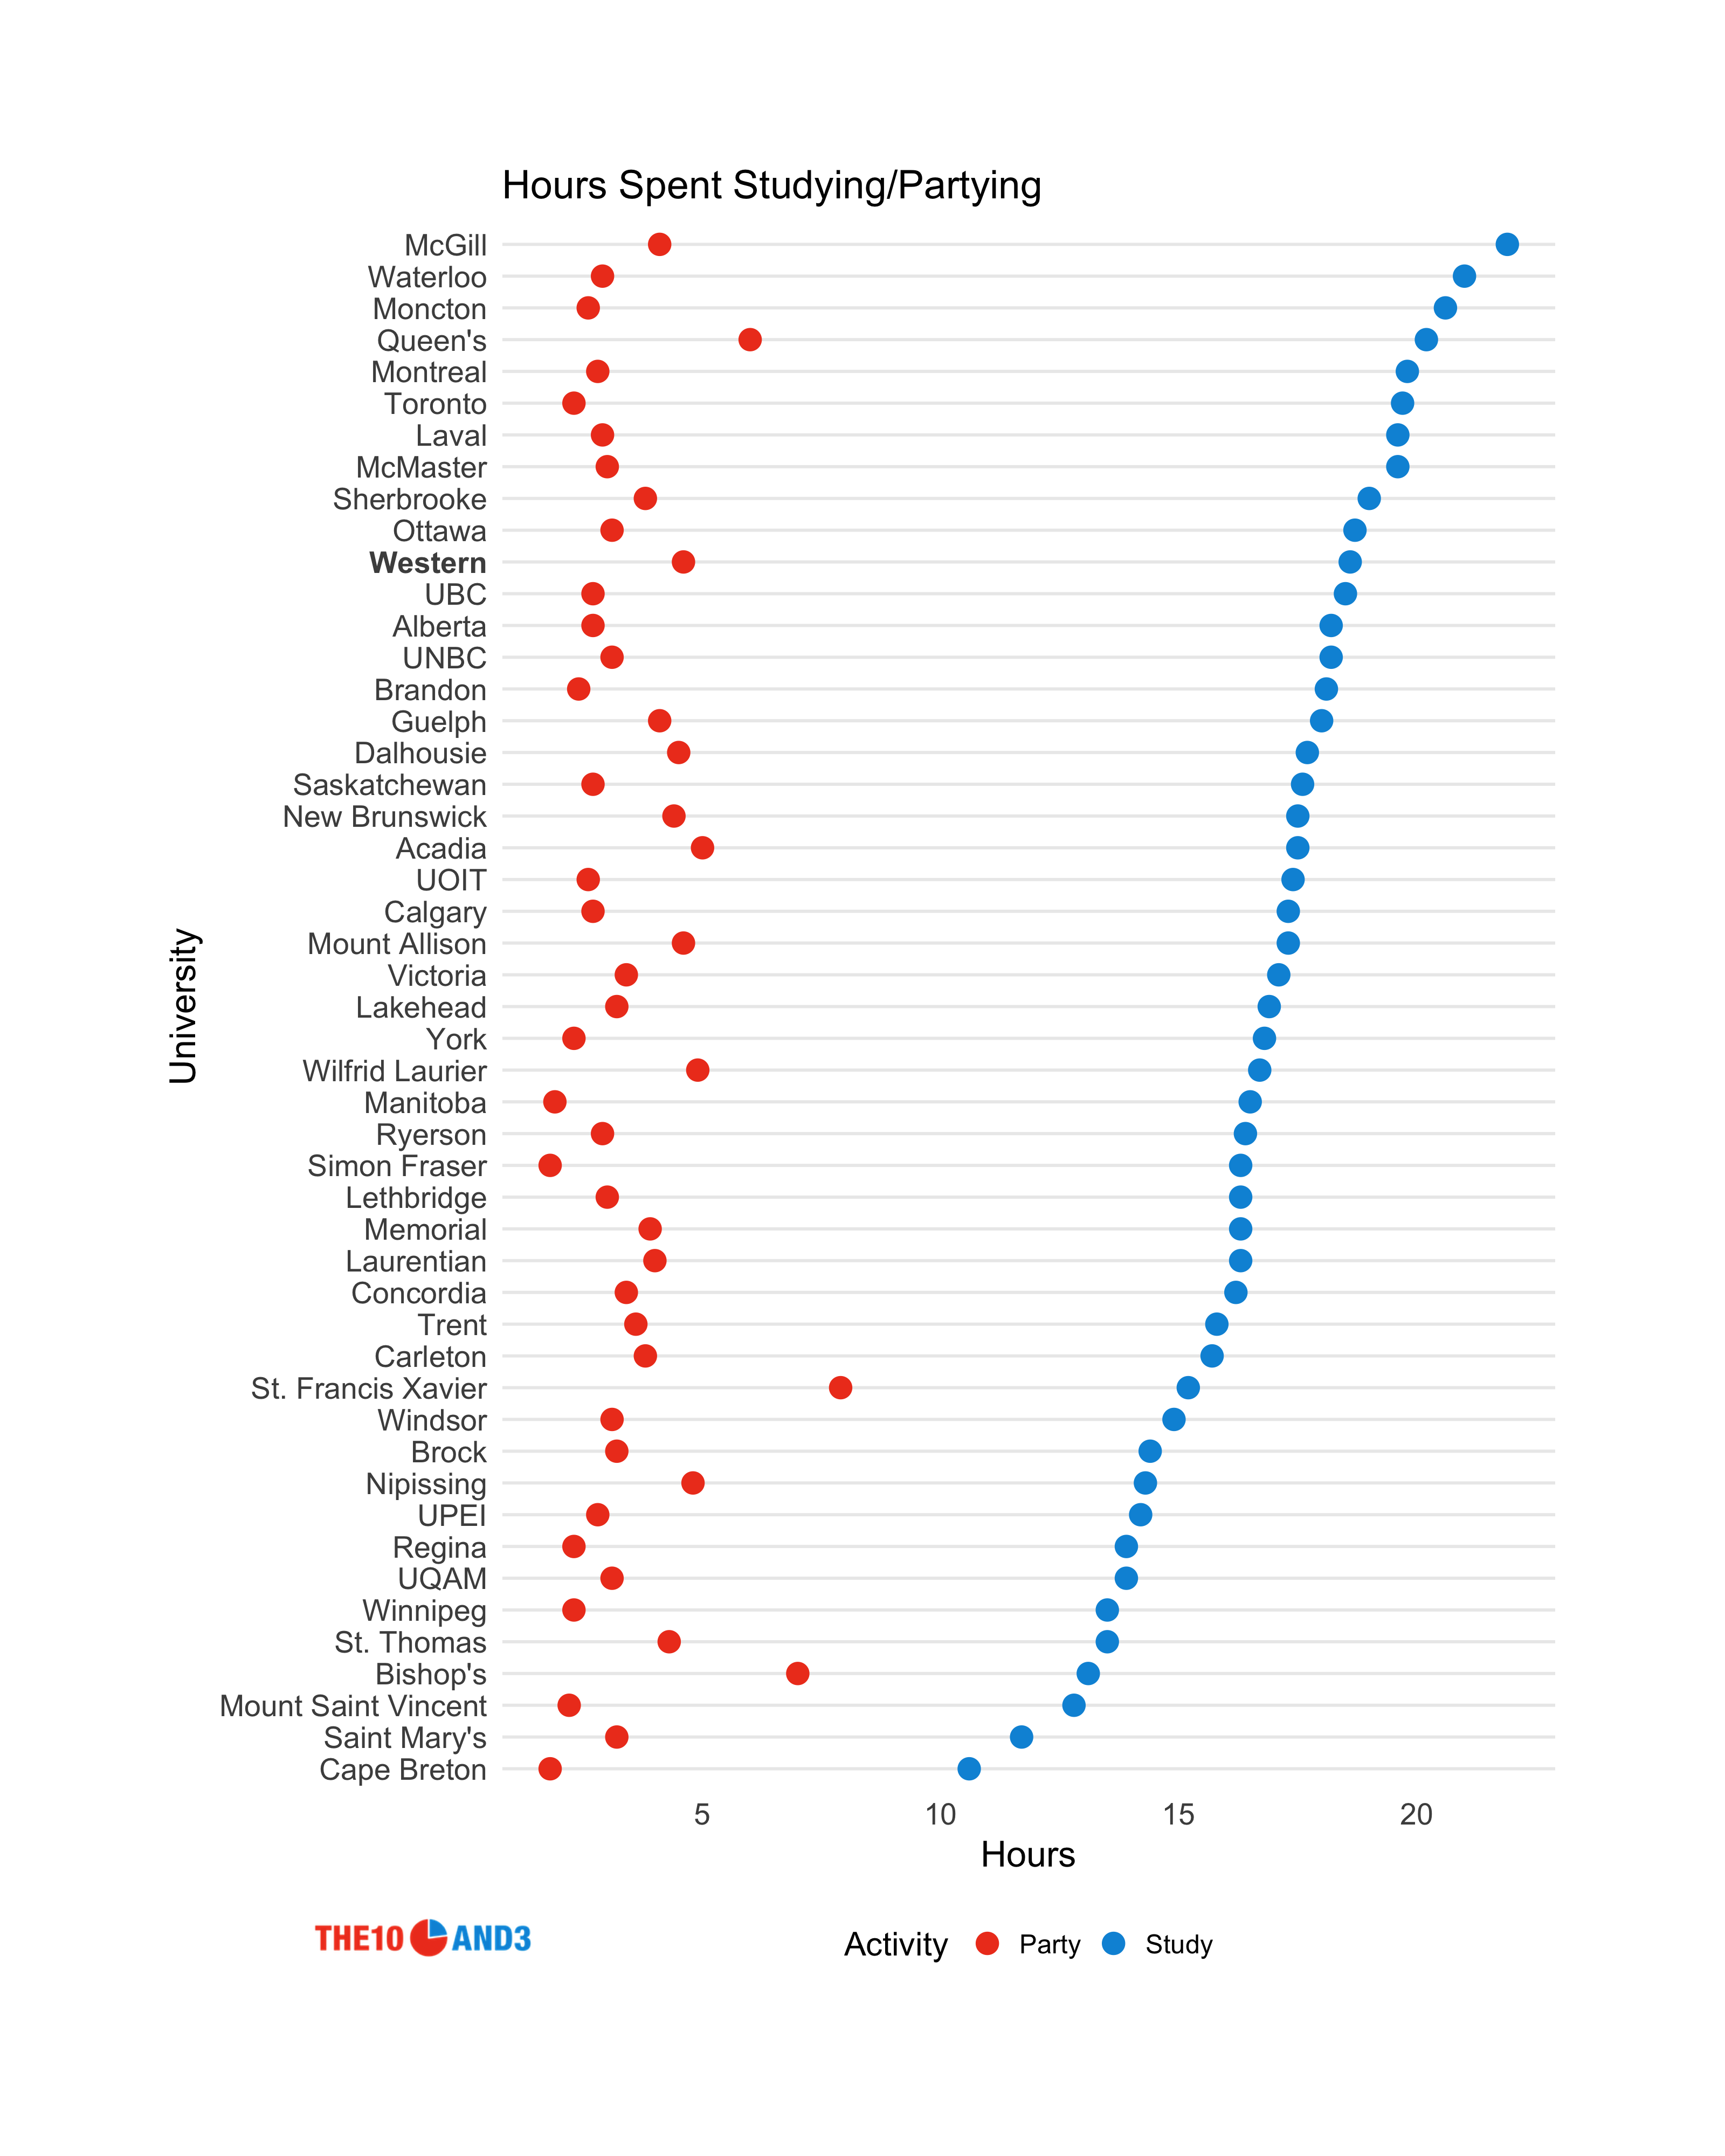
We first dig into the Maclean’s dataset to examine how long, on average, students at Canadian universities spend partying or hitting the books. When sorting by time spent studying, we find McGill and Waterloo at the top (21.9 and 21 hours per week, respectively), while St. Mary’s and Cape Breton round out the bottom of the list (11.7 and 10.6 hours per week respectively). On the partying front, St. Francis Xavier (7.9 hours) and Bishop’s (7.0 hours) top the list, while Manitoba (1.9 hours) and Simon Fraser (1.8 hours) bring up the rear.

A charts showing the hours spent studying vs. partying across Canadian universities

Western students, interestingly, hover near the top of the list for both partying and studying, while Queen’s students are even more extreme, outranking their peers at Western in both studying and partying (while not having the party school label). So what are we to make of these work-hard, party-hard institutions?

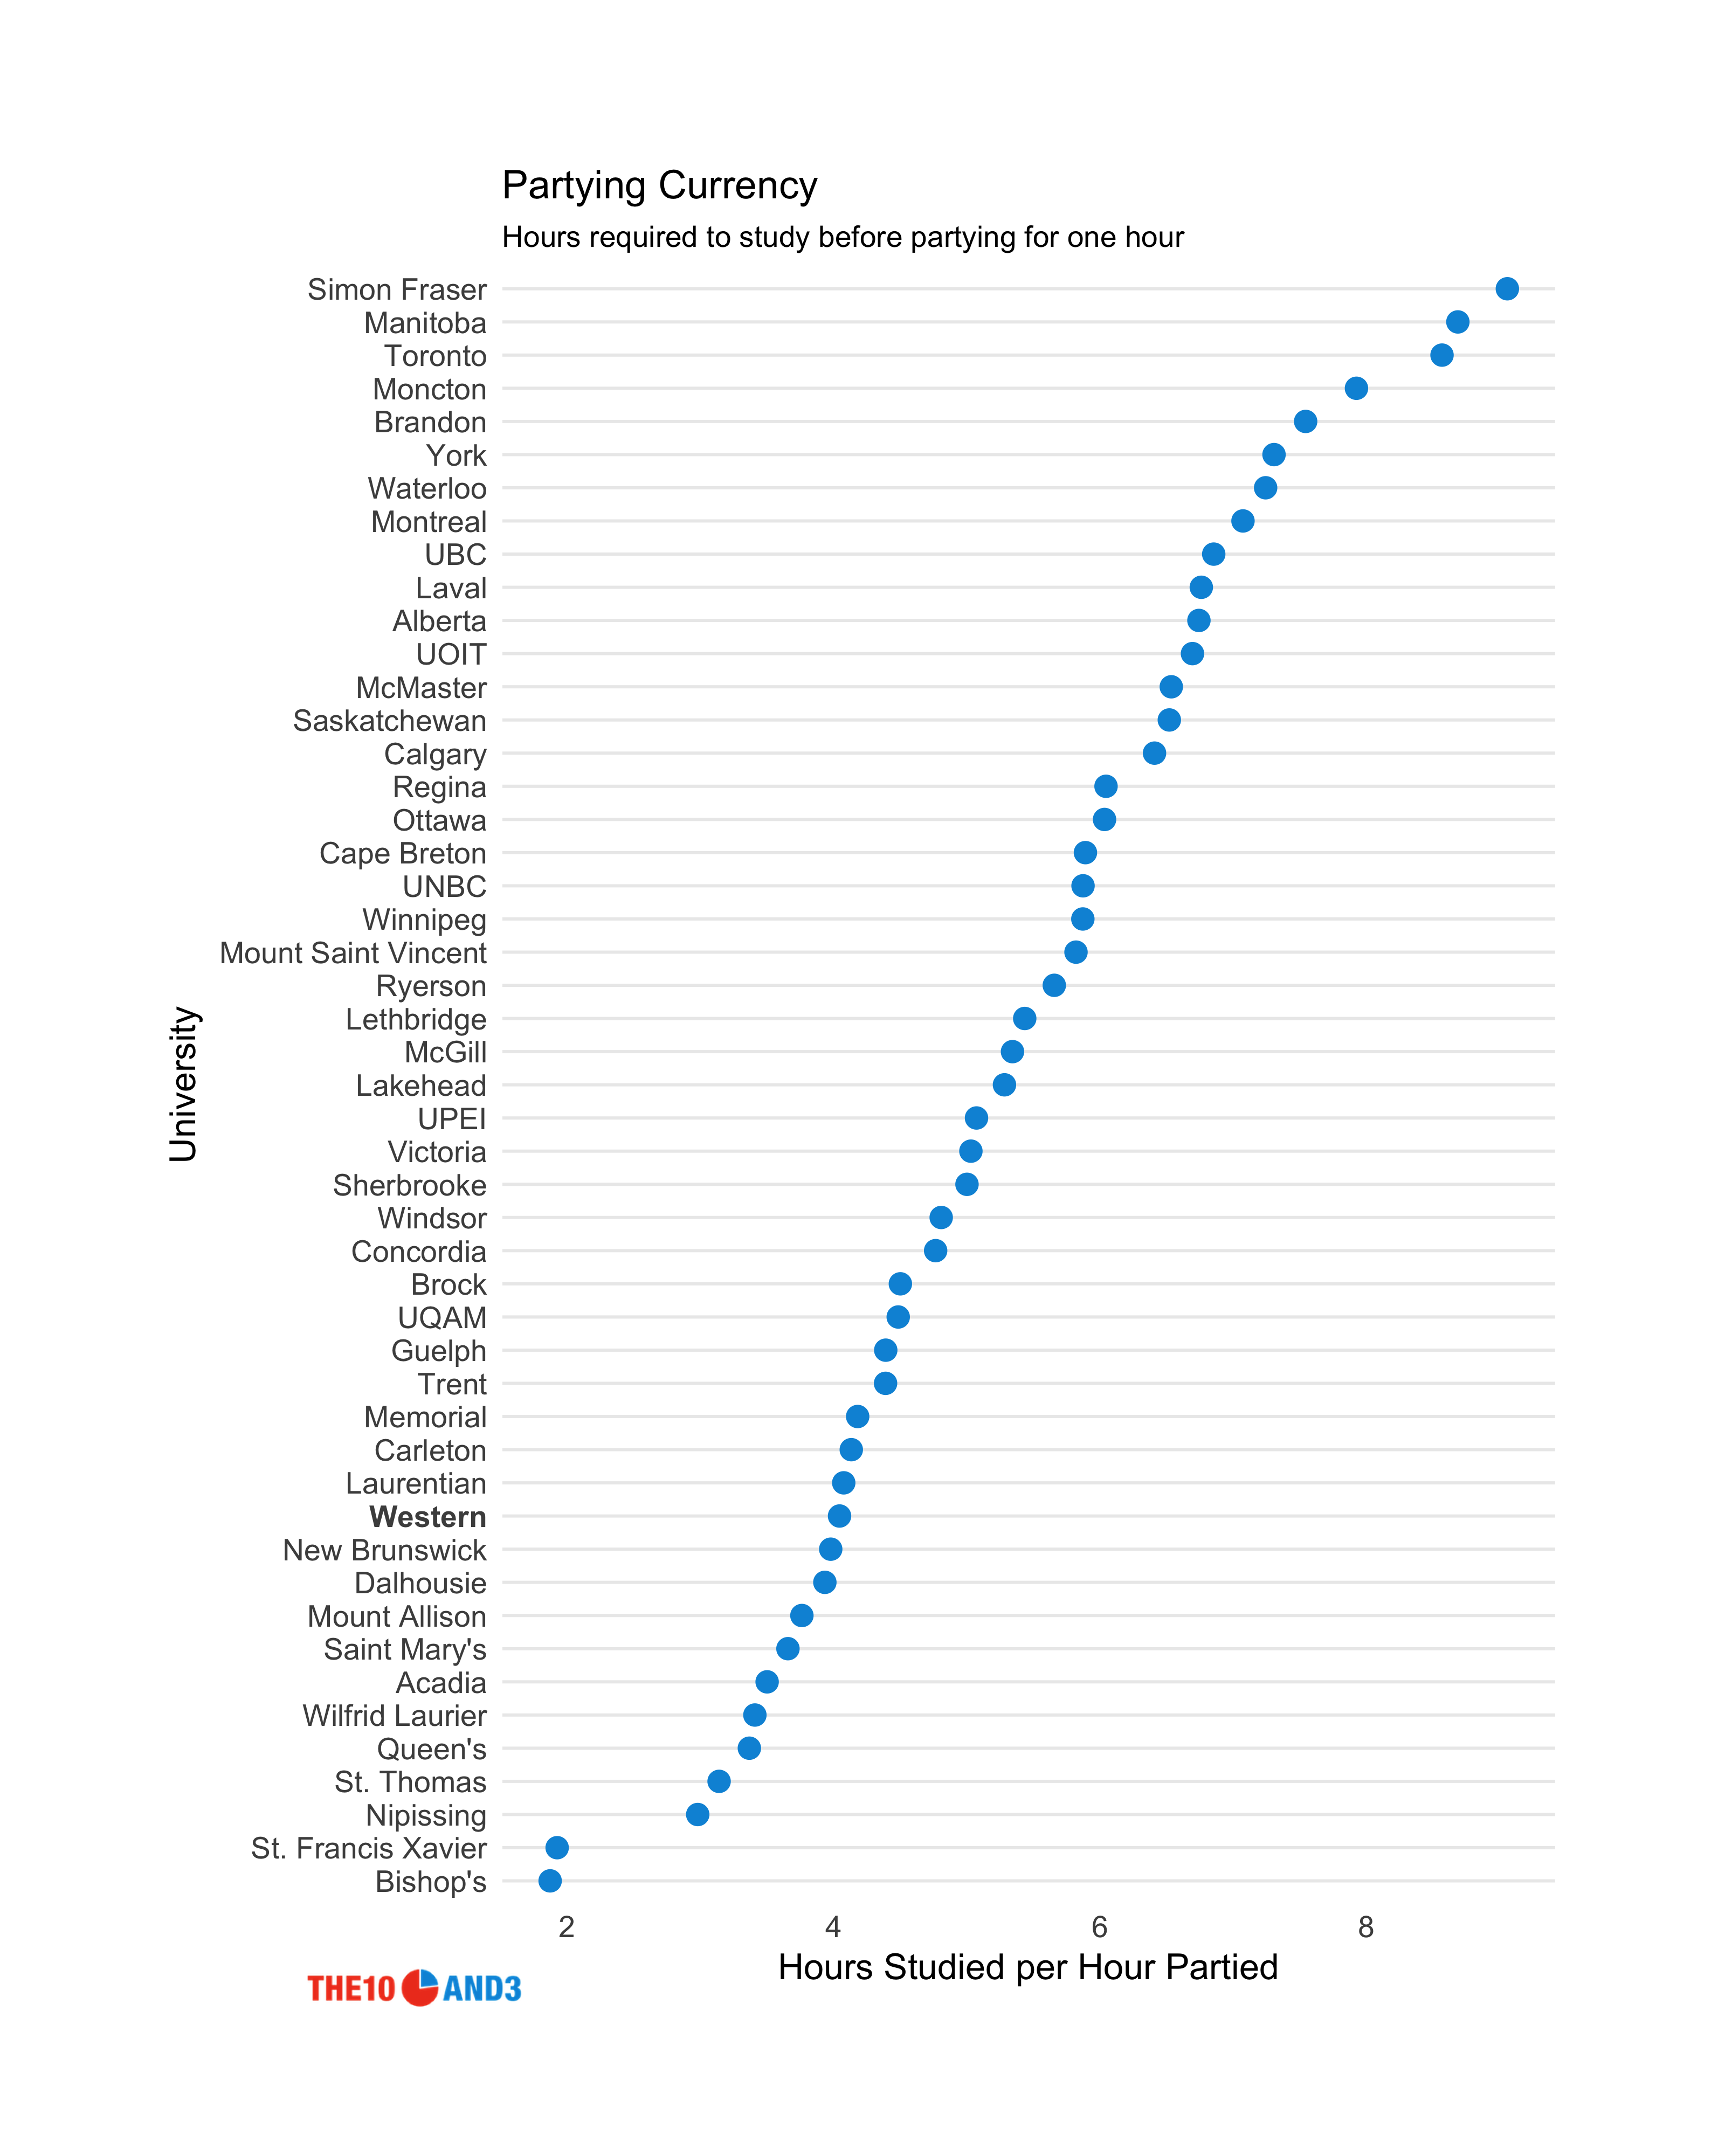
The interplay between time spent studying and time spent partying is complex, and we need some sort of currency to understand how the two measures are related. The simple ratio of hours spent studying divided by hours spent partying captures the concept well. You can think of this as buying time to play after the hard work of writings essays and finishing problem sets.

A charting showing the number of hours of study required before the average student at a specific university will party for one hour

In order to buy one hour of partying, you need a certain number of hours studied.  Want to party twice as long? Well, then you need to work twice as much.  Schools with a lower measure think that their study time buys them a lot of party hours, and so reward themselves after a minimal amount of work. Schools with a higher measure don’t think that their study time entitles them to much party time at all, and therefore feel like they have to put more work in before enjoying a single hour of partying.

Western ranks 12th from the bottom on this measure with a currency of 4.0 hours of studying per one hour of partying, well below the median of 5.3 hours of studying per one hour of partying. Queen’s, which ranked higher than Western on both raw measures, spends 3.36 hours studying before going to party for an hour — these kids appear to play harder than those at Western!

Simon Fraser, Toronto, and Waterloo are near the top of the list with 9.0, 8.5, and 7.25 hours spent studying, respectively, before partying for a single hour. That is just as long, if not longer, than a typical work day, and these schools’ reputations for being among the most academically rigorous in the country are at least partially borne out by the numbers.

At the other end, we have two clear standouts, with Bishop’s just edging out St. Francis Xavier as having the most valuable study time. Students at these two universities spend less than 2 hours studying before going out to party for an hour. That’s 30% less studying (per partying hour) than their nearest counterpart, Nipissing, a remarkable 50% less than Western, and nearly 80% less studying than Simon Fraser.

Finding like-minded schools

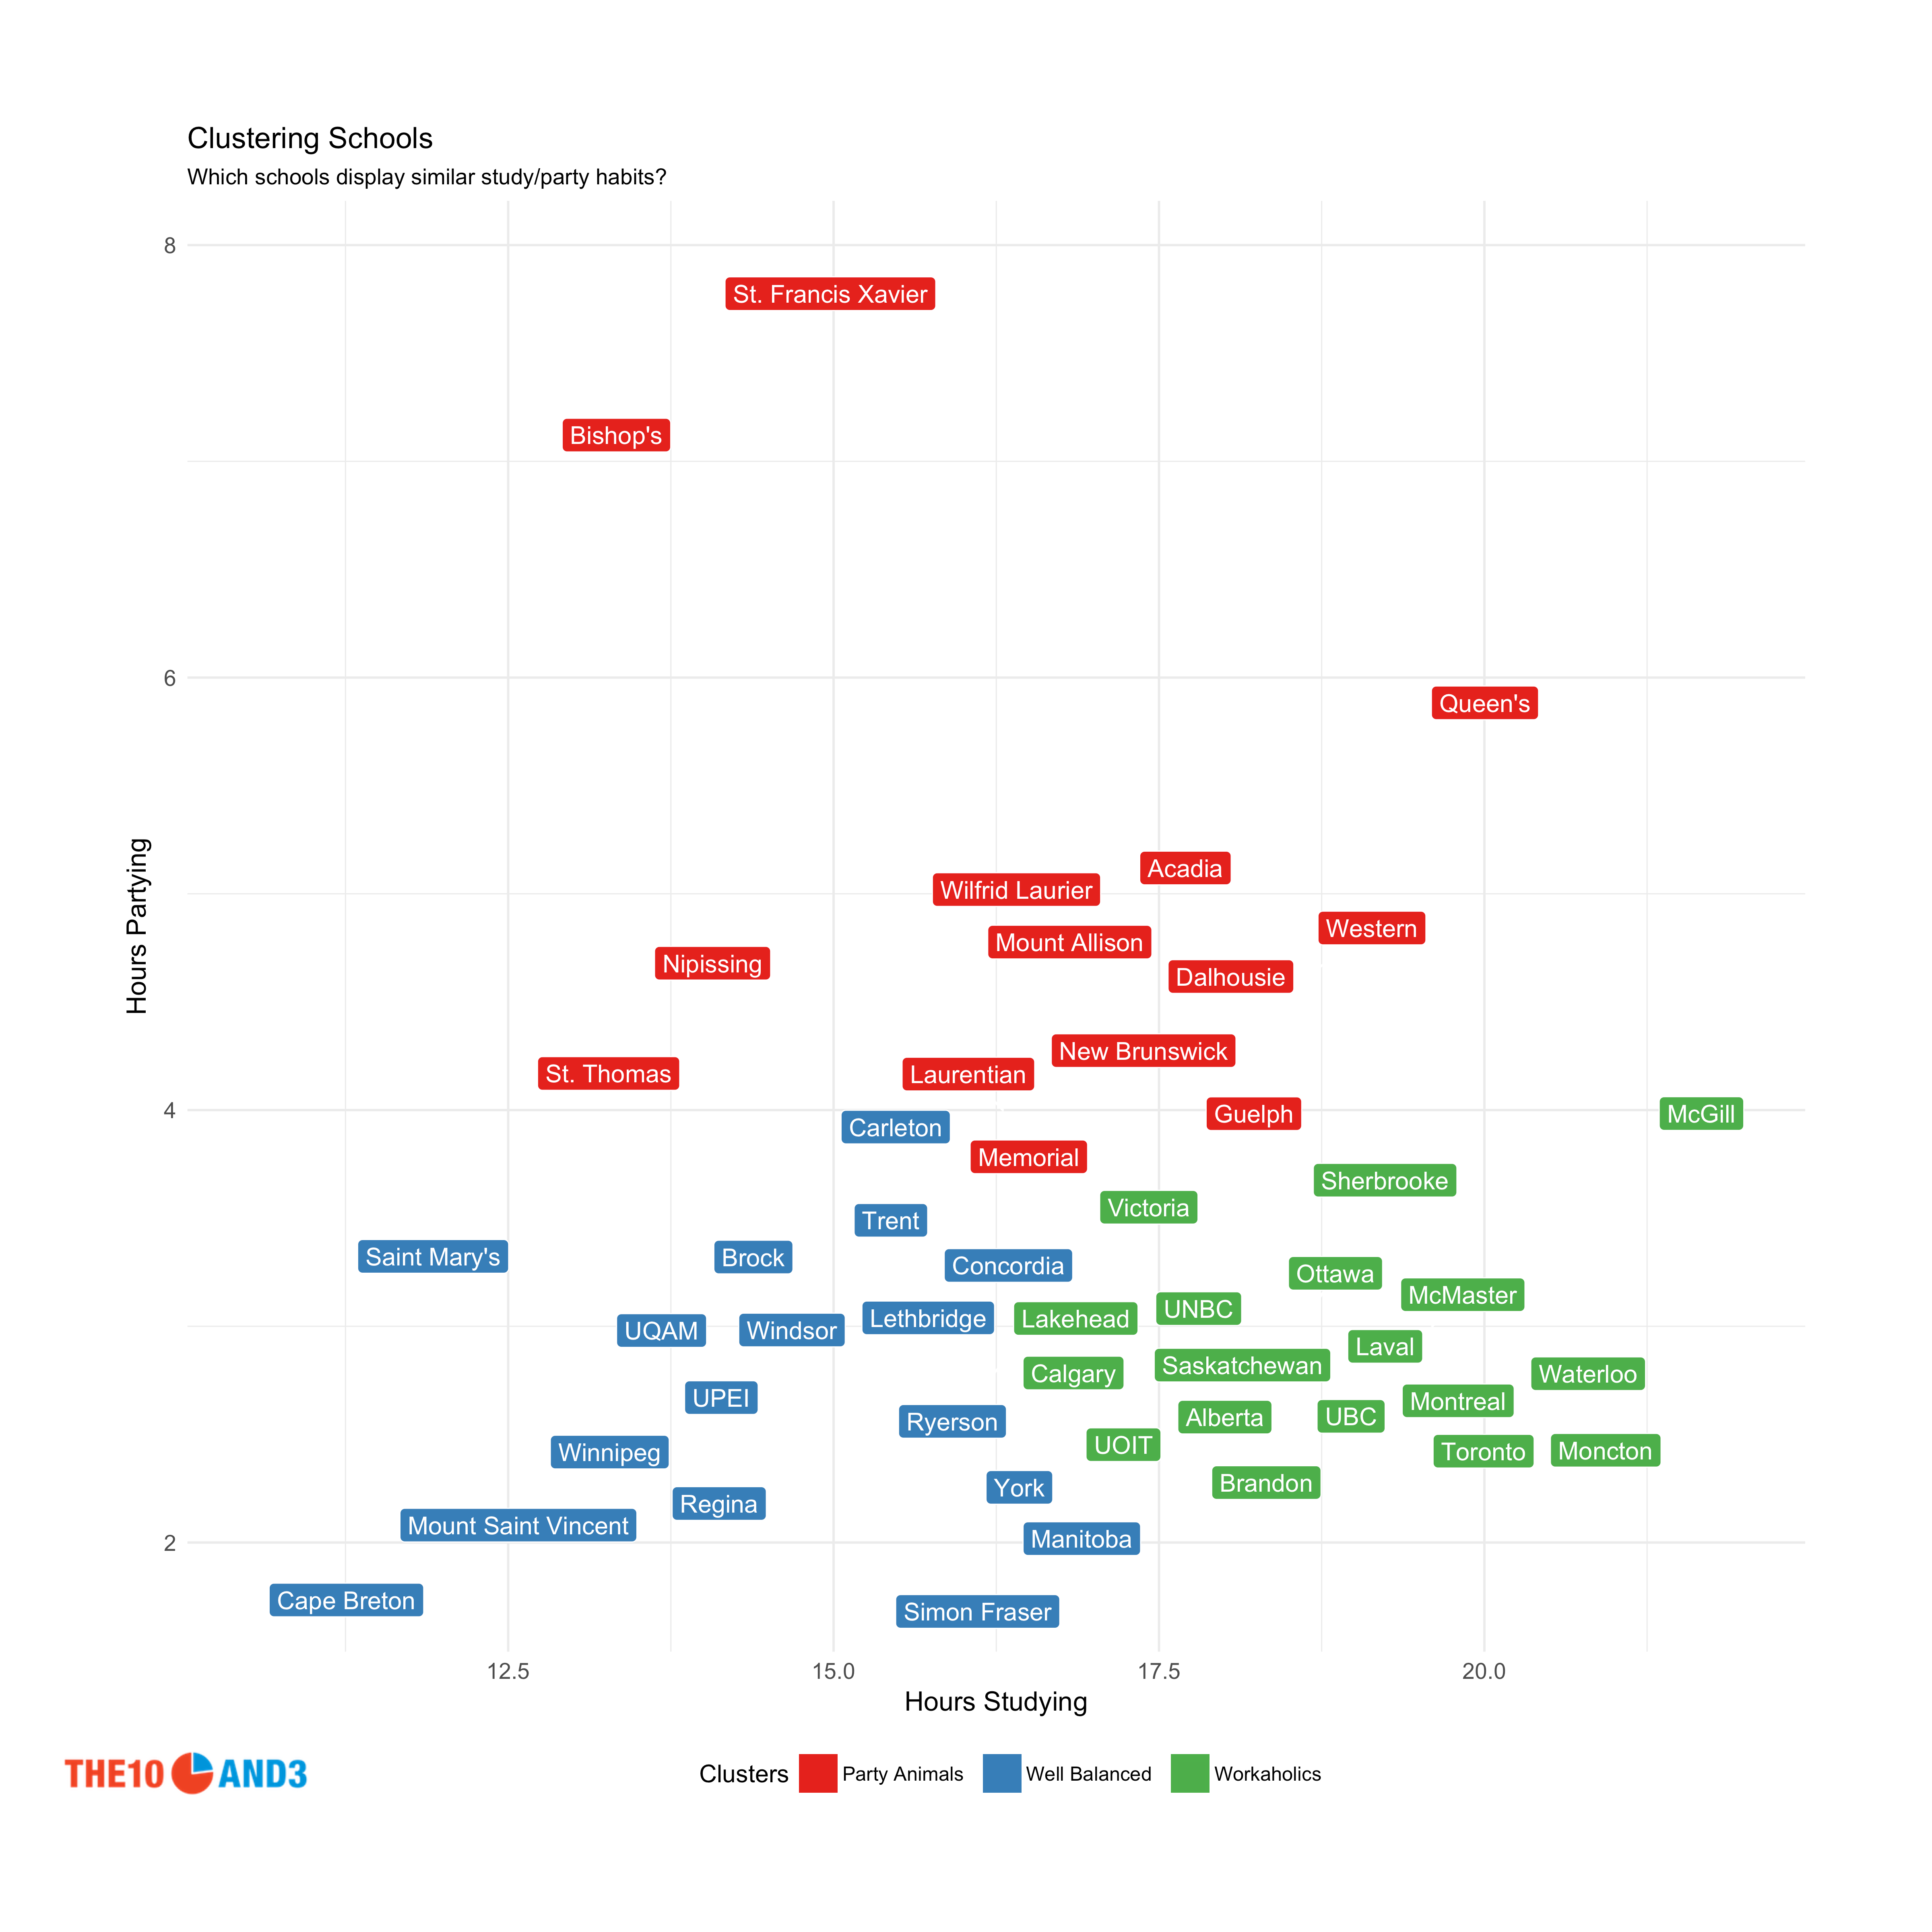
The currency measure is a good way of understanding how valuable students think their study time is, but it still doesn’t tell us the entire story. We can apply some standard k-means clustering techniques in order to divide up the schools into their natural groupings, or clusters.

A chart showing how schools cluster into one of three categories based on their relative partying

Our clustering algorithm tells us that there are three distinct groups in the data: schools where students study a lot (the “workaholics”), schools where students party a lot (the “party animals”), and schools where students don’t do much of either (the “well-balanced” group).

The “workaholics” spend nearly 18.8 hours studying but just 2.9 hours partying on an average week.  These schools include Toronto, Waterloo, and McGill.

The “well-balanced” group clock in at just 14.7 hours of studying and 2.7 hours of partying on an average week.  These schools include Ryerson, Simon Fraser, Brock, and Windsor.

Finally, the “party animals” study around 16.5 hours a week but party 5 hours per week.  These schools include Laurier, Guelph, and Dalhousie.

The clusters seem to reveal a clear pattern on where students are choosing to spend their time. On average, students at every university in Canada will spend roughly 14.5 hours studying and 2.5 hours partying, regardless of their other tendencies. Every school has an extra 4 hour chunk per week that they can spend as they wish, but how they choose to spend those four hours depends on which cluster they belong to. The workaholics put all four of these hours into studying, while the party animals put two hours into studying and the remaining two into partying. The well balanced group seem to put these four hours into some other activity (maybe in the gym or at school club events, or just relaxing).

An undeserved reputation?

Where does all this leave the hard-living reputations of universities like Western, St.FX and others? Playboy may have gotten the story partially right; after all, the data does suggest that Western students do belong to the cluster of “party animal” universities in Canada. But they are nowhere near the top of that class, with Bishop’s students edging out those of St.FX when valuing (lots of) partying against (very little) studying.

Don't miss our newest maps, charts and stories. Sign up now to have them delivered to your inbox.

The Most Common Street Names in Canada

It’s 7204 km from Victoria, British Columbia in the west to St John’s, Newfoundland in the east, and 4529 km between Alert, Nunavut in the north and Windsor, Ontario in the south. Connecting this big, beautiful landmass is a network of thousands of roads, all named after something or someone. This got us thinking: what are the most popular names among Canadian streets? How do their numbers reflect the values and history of the Great White North?

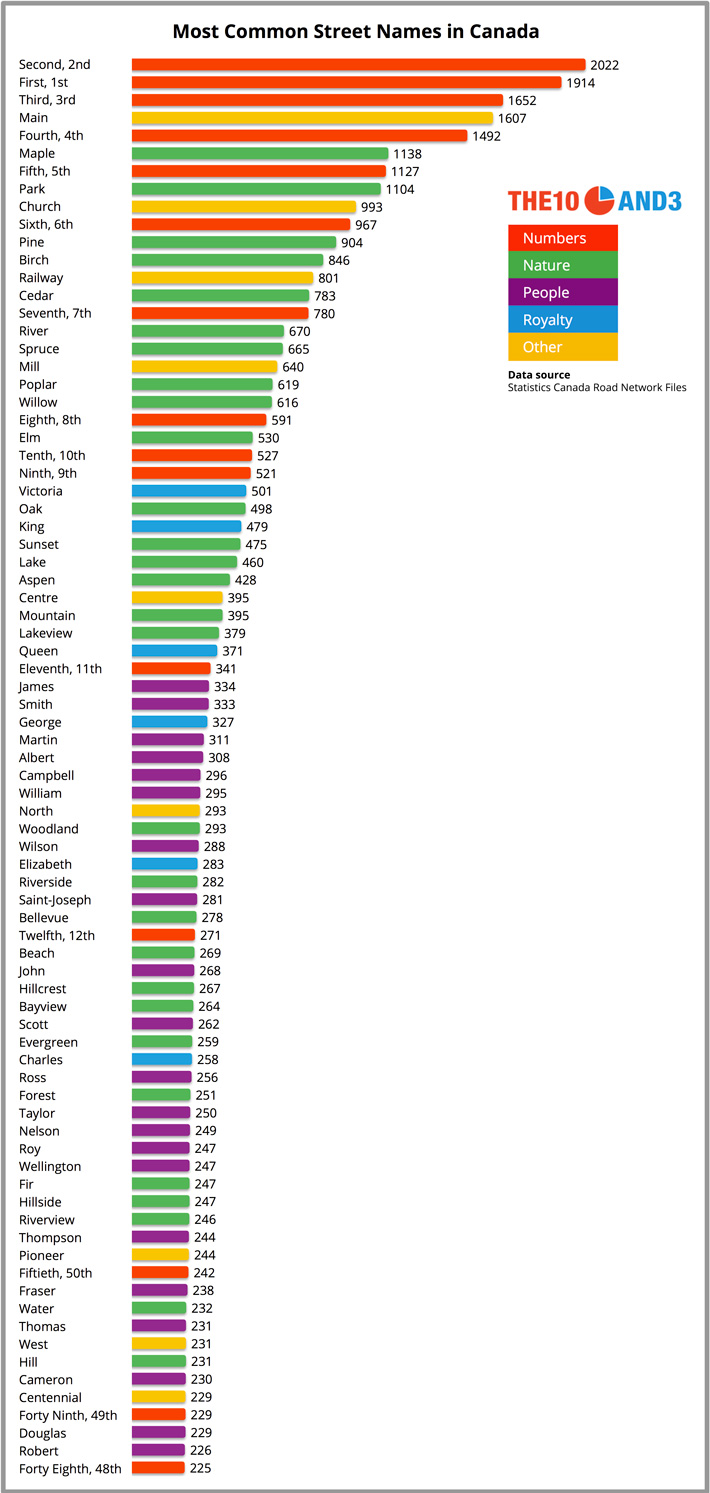
As it turns out, Canada’s most common street name is a number: Second. But this finding isn’t actually that surprising, as Second is also the most popular street name in America, according to an article from FiveThirtyEight. Numerical street names in fact feature quite prominently in our list. Out of the top ten names, six are numbers (it’s seven out of ten for American street names). But there are a few key differences that distinguish Canada’s list from America’s. Maple cracks the Canadian top ten, for instance. There are also nods to the British royalty as well as to our French heritage, and references to famous Canadians throughout history. Second may be the top name for practical reasons, but the rest of the list provides a window into Canada’s culture and values.

We wanted to produce the most holistic and accurate list of street names in Canada, and extracted this data from Statistics Canada’s Road Network Files for 2015. We computed the 80 most common names after combining numerical monikers like “First”, “1st”, “1E” and “Premier” together; moreover, French words (apart from proper nouns) were included with their English translation in the final count. For example, the common Quebec street name “l’Église” was combined with the common English Canada street name “Church”.

Most Common Street Names in Canada

Numbers

Of course numerically named streets are common, but it’s notable that Second (at 2022 occurrences) — and not First — is the top street name in all of Canada. This is because streets named Second do not necessarily follow a First street. As explained in FiveThirtyEight’s analysis of American street names, Second will often come after whatever serves as a city’s primary thoroughfare, be it First Street, Main Street, Front Street or something else (see Lakeview, Nova Scotia, for instance). The numbers continue in the list in relatively ordinal fashion up to Twelfth, after which the next most common street name number is Fiftieth (242). That’s a pretty big jump between street numbers.

The popularity of Fiftieth comes from Alberta, where the intersection of 50th Avenue and 50th Street serves as the midpoint of many urban municipalities – 41% of the province’s cities follow this pattern. The model of assigning high numbers to the streets at a city’s midpoint is said to have spread from Edmonton (which centres at 101st and 101st/Jasper), and became a popular and easy navigation system among central and northern Alberta towns. In the 1920s the prominent natural gas supplier Northwestern Utilities liked Edmonton’s approach so much that they incorporated it into their expanding gas network – a city had to adopt the 50th Avenue/50th Street midpoint in order to get Northwestern Utilities’ services.

Nature

References to nature dominate the list, which is not surprising since Canada is a veritable blanket of breathtaking natural scenery. These mostly appear in the form of tree species and landscapes rather than animals – perhaps “Moose Street” or “Caribou Crescent” couldn’t be taken seriously by developers. Only the noble Canadian Beaver (154) makes it onto the list. The most common reference to nature is Maple (1138), the emblem on the nation’s flag and symbolic of the syrup for which Canada is so well known. This is followed by Park (1104) and Pine (904), Canada’s most common conifer.

The list of American street names also featured many references to nature, but Canada’s includes some absent from the American list – Mountain (395) and Evergreen (259), for instance. Other nature names unique to Canada’s most popular list include Aspen (428), Riverside (282), Beach (269), Bayview (264), Hillside (247), Riverview (246) and Water (232).

Royalty

It comes as little surprise that names of royal descent appear on the list before those of famous Canadians. Victoria (501), King (479) and Queen (371) are more common than any historic Canadian, a testament to our enduring if not complicated ties to the British monarchy. After all, Queen Victoria has 501 streets named after her and a federal holiday to boot, while Canada’s first Prime Minister, John A. MacDonald, didn’t even make it onto the list. Now the Widow at Windsor can add “most common street named after a person in Canada” to her list of accolades.

Other names’ origins remain ambiguous. Are they tied to royalty or not? For instance William (number 42 on the list with 295 streets) could be King William IV of the United Kingdom, William Lyon MacKenzie, or another William entirely. We just don’t know.  

Famous People, Places and Monuments

There are some streets with obvious references to famous Canadians, however. Campbell (296) is likely in honour of one of Canada’s Fathers of Confederation, Sir Alexander Campbell. Fraser (238) is probably in recognition of Simon Fraser, acclaimed explorer and fur trader. Same for Thompson (244), likely named for the explorer and cartographer David Thompson.

Bellevue (278) is one of the only names on the list referring to a specific place or monument. Some of these streets could be named after Sainte-Anne-de-Bellevue, one of the oldest communities in Montreal. Others could be for Bellevue House, an elaborate villa that was leased to John A. Macdonald before his time as Prime Minister. Also in this category is Saint-Joseph (281). These streets could be named after Montreal’s largest church, Saint Joseph’s Oratory of Mount Royal in Montreal, the various towns named Saint-Joseph, or for the Great Saint of Everyday Life himself.

As with royalty, it can be hard to determine which famous person these streets are recognizing. James (334) could be in honour of Welsh sea captain Thomas James, for whom James Bay is also named. Some could be in honour of King James. But really, the name James is so common it’s impossible to determine exactly which famous James is being saluted. Same with streets named Douglas (229), which may pay tribute to David (namesake of the Douglas fir) or Sir James (Governor of Vancouver Island and British Columbia).

So what can a list like this really reveal about Canada’s history and values? While it is certainly shaped in part by regional quirks, the list does seem to suggest certain ineffable values: British before Canadians, Maples before Pines, cartographers before fur traders. Regardless, we’ve confirmed that Canadians not only love their trees, but love naming their streets after them – especially trees that provide the delicious nectar so emblematic of the country’s soul.

Methodology

We used StatsCan’s comprehensive mapping database that includes every street in Canada. We grouped streets together in the list in the following cases: a) numbered streets that have essentially identical meanings, such as First/1st/1/1e (streets like 1A, 1B were not grouped because they tend to exist where there is already a First/1st Street) and b) French words were combined with their English equivalents, such as Church and l’Église. Most streets are easily classified according to nature, royalty, etc., though some required an arbitrary decision (ex. classifying Charles as royalty).

Don’t miss our newest stories! Follow The 10 and 3 on Facebook or Twitter for the latest news and analysis.

Don't miss our newest maps, charts and stories. Sign up now to have them delivered to your inbox.

Tessa and Scott

Which Canadian Olympic Athletes Became Social Media Juggernauts?

The Canadian Olympic team took in a record medal haul this year in PyeongChang, bringing home 29 medals in sports such as freestyle skiing, short track speed skating and figure skating. But it was a handful of high-profile Canadian athletes whose medal-winning performances rocketed them to superstardom around the country, and on social media. With an athlete’s marketing power increasingly measured by their social media influencer status, it was Canada’s brightest figure skating stars, as well as a few of their friends on the snow, who benefited the most from their Olympic success.

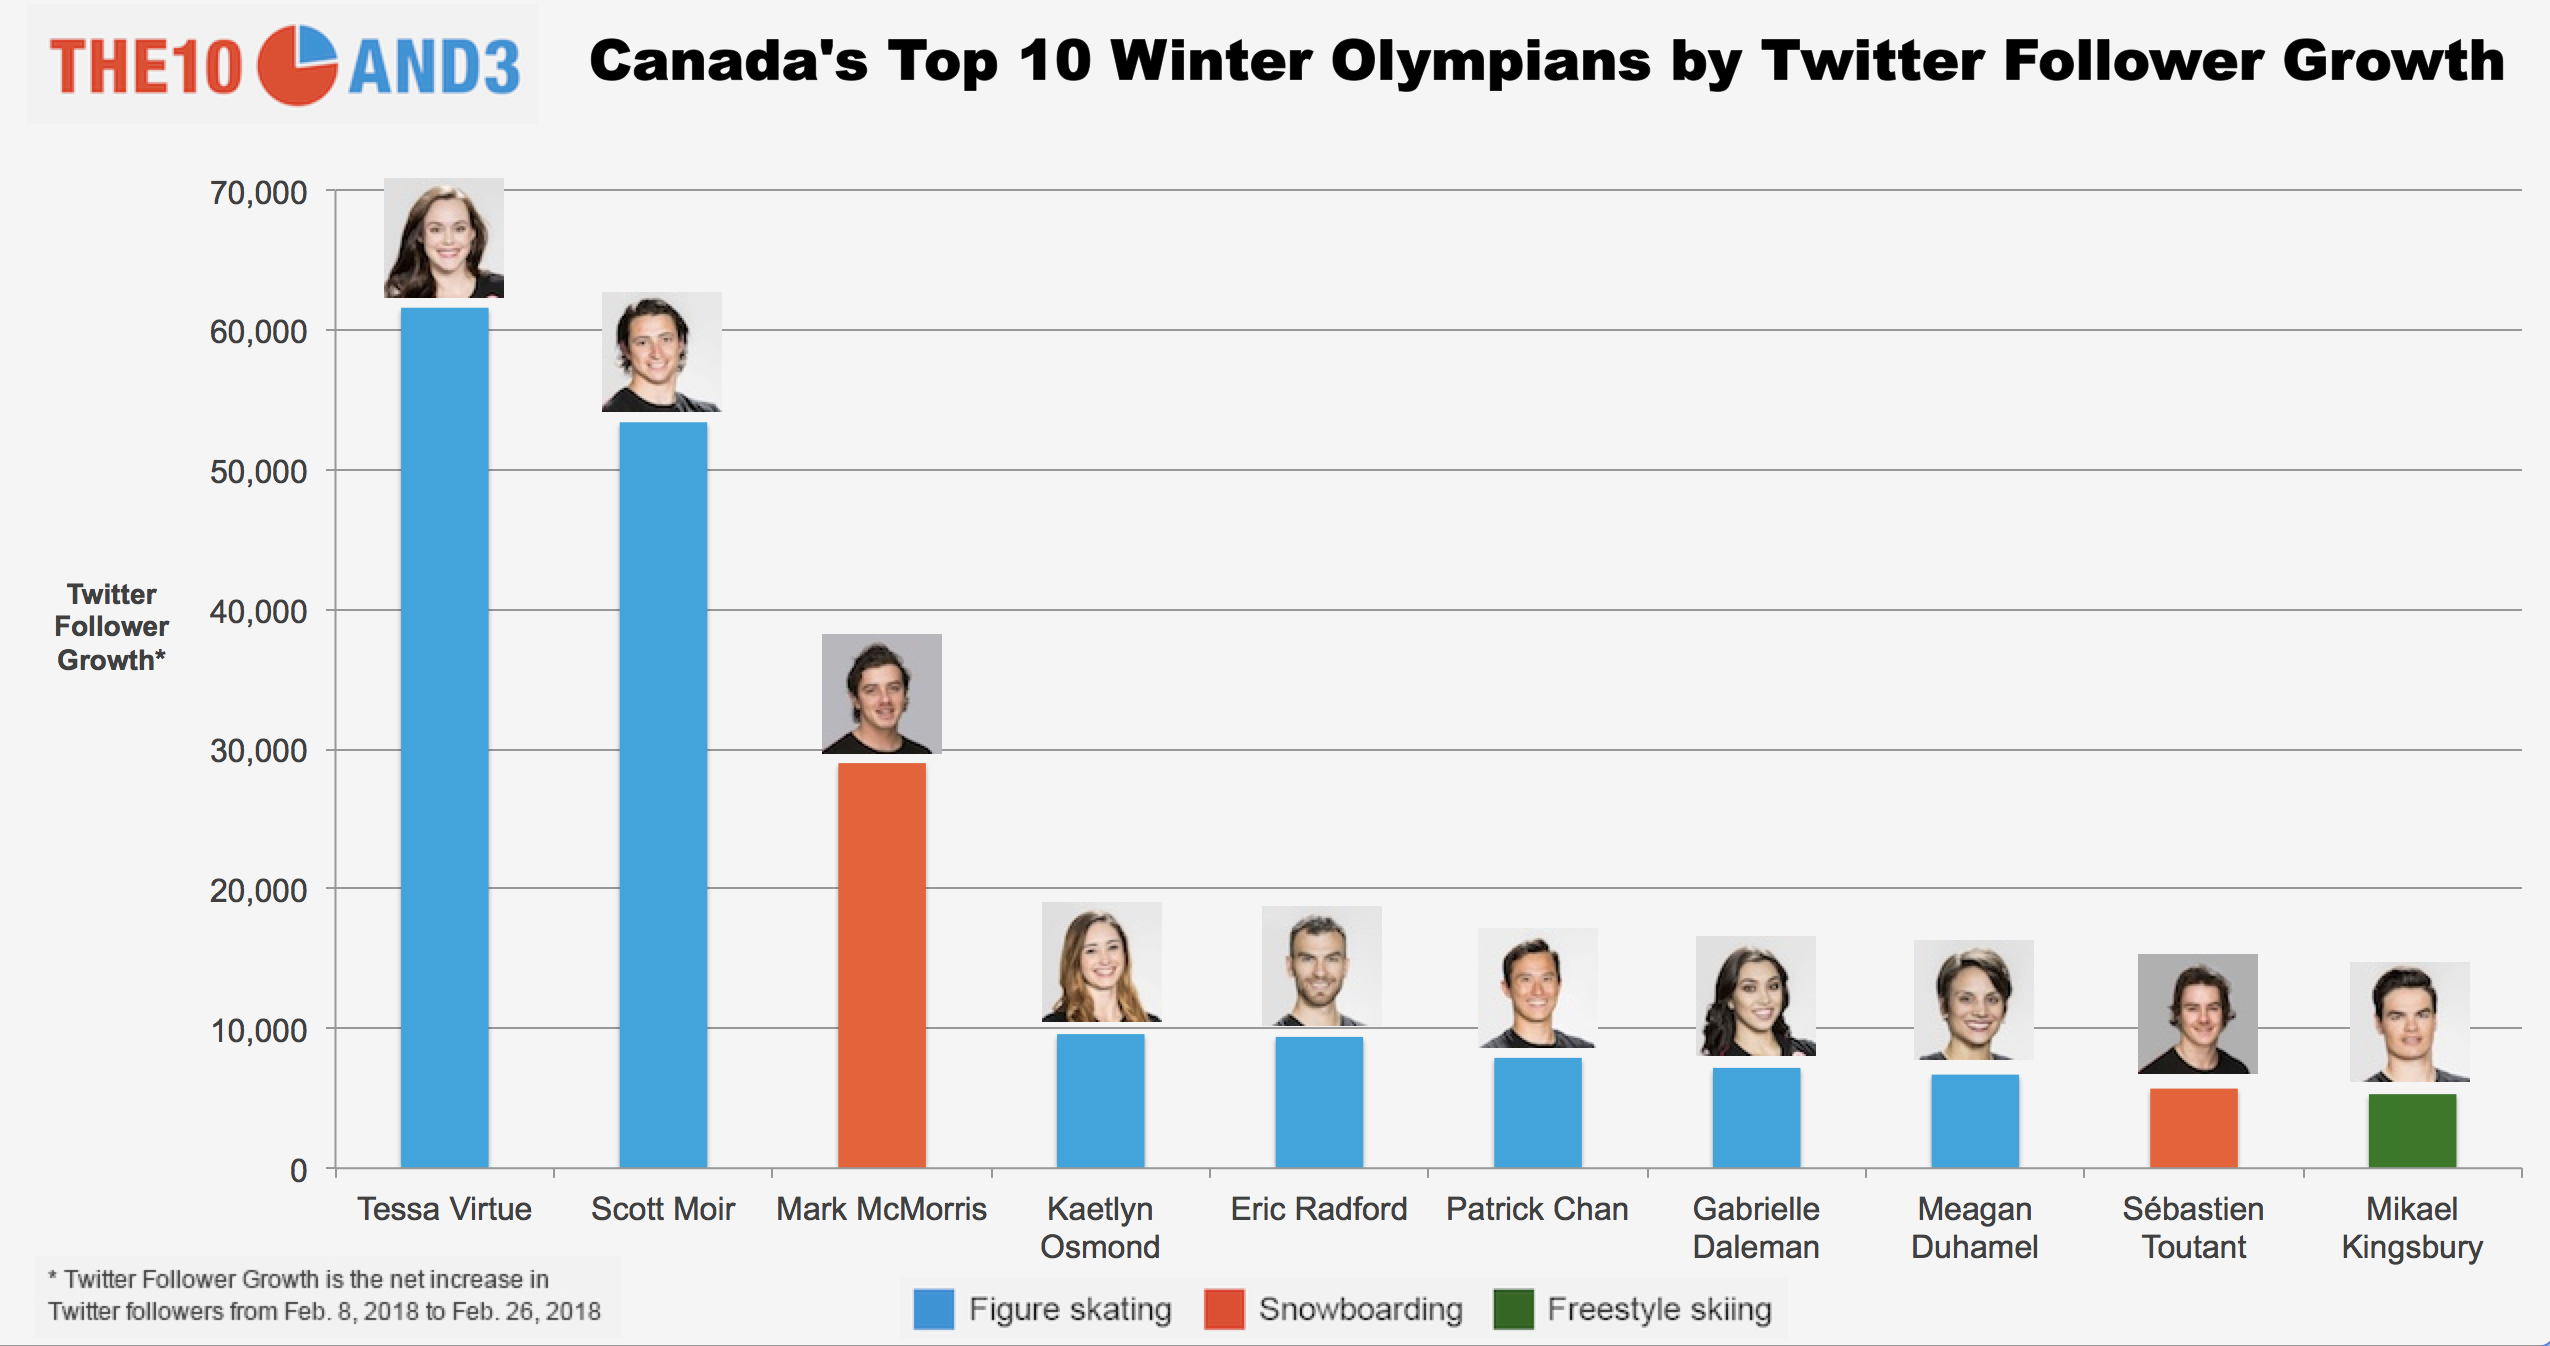
To see which athletes raised their profile the most, we looked at the Twitter follower count of every Canadian Olympic medal hopeful just before the Games, on February 8, and just after, on February 26.

Chart of Canada's Top 10 Winter Olympians by Twitter Follower Growth

Canada’s figure skating team, with its medals in the team, ice dance, pairs and women’s competitions, dominated the Olympics. But they also dominated the social media game, with gold medalist ice dancers Tessa Virtue and Scott Moir increasing their follower count by well over 50,000, and fellow team members Eric Radford and Meagan Duhamel (pairs bronze), Kaetlyn Osmond (women’s bronze), Patrick Chan and Gabrielle Daleman increasing their counts by over 5,000 followers.

What is it about figure skaters and social media? First, all of the figure skaters in the top 10 won the team medal at the outset of the Olympic Games when viewer engagement was still high, resulting in significant television exposure in Canada. Moreover, figure skating coverage, unlike coverage of  full-helmeted winter sports like bobsled, snowboard or even hockey, tends to focus on athletes’ faces and personalities, while the extensive kiss-and-cry scenes after each performance further highlight individual performers.

But Tessa and Scott are no doubt a special case, even among the figure skaters. They were Canada’s flag bearers at the Opening Ceremonies, and their story of redemption after just missing out on gold in Sochi was an irresistible marketing story. Add in the wall-to-wall coverage on both Canadian and American TV of both their skating performances and their are-they-or-aren’t-they dating drama, and you have natural recipe for social media success.

Of all Canada’s Olympic athletes, snowboarding star Mark McMorris began the Olympics with the most Twitter followers, at 171,000. Despite missing the top of the podium, McMorris’ bronze in slopestyle just 11 months after a near fatal injury was enough to propel his Twitter follower count upward by almost 30,000. (His sponsorship deal with Visa didn’t hurt either). Patrick Chan was initially second in the count with 81,000 followers; despite a relatively disappointing final Olympic Games that saw him miss the podium in the men’s competition, Chan still managed to bump his count by 8,000 followers.

Finally, we remark that gold medals alone don’t necessarily mean a big increase in social media following. Sebastien Toutant, who soared his way into history with a gold medal in the inaugural Big Air snowboarding event, added a measly 5,600 followers; unlike teammate McMorris, a medal means less in the follower competition without a compelling backstory (nevertheless, Toutant is already a moderate social media star due to his success on the X-Games circuit). Sam Girard, who won gold in 1,000m short track speed skating, gained just over 1200 new followers; gold and silver medalist Ted-Jan Bloemen, the imported Dutch-Canadian long-track speed skater, eked out just over 1000 new followers; and Justin Kripps, the phenomenal bobsled driver who tied with Germany for gold in the 2-man competition, gained fewer than 800 followers.

While medals do matter (those who won medals gained, on average, 8,000 followers while those who didn’t gained fewer than 750), they clearly don’t tell the whole story about social media attention. If a sport isn’t popular, an Olympic athlete has very little chance to raise his or her profile.

Don't miss our newest maps, charts and stories. Sign up now to have them delivered to your inbox.

Wrongful Conviction Large

The Long Road to Overturning a Wrongful Conviction in Canada

In 1992, Maria Shepherd pled guilty to a crime she didn’t commit: killing her three-year-old stepdaughter. Her lawyer told her she didn’t stand a chance against the testimony of renowned pathologist Charles Smith. Knowing she could spend years in prison away from her young children if she fought and lost her case, Shepherd pled guilty to manslaughter and lived with a wrongful conviction on her record for 25 years.

Thanks to the lawyers who worked on her behalf and a public inquiry that discredited the doctor, Shepherd’s wrongful conviction was finally overturned in 2016 on appeal. Although she only spent eight months in prison, less than half of her two-year sentence, the consequences of her wrongful conviction stayed with her for decades.

“It really does rob you of your mental health,” says Shepherd, who had three children under the age of five and was pregnant at the time of her incarceration. Shepherd says she pled guilty out of fear that she could lose custody of her children if she were incarcerated for years instead of months.

The clinching detail in Shepherd’s case, later found to be unsubstantiated, was a bruise on three-year-old Kassandra, which Smith said matched her stepmother’s watch and was evidence of a fatal blow. But the inquiry into Smith’s forensics found that his background in forensic pathology was severely lacking and that many of his conclusions on the stand were unsupported by science, contributing to other wrongful convictions in addition to Shepherd’s.

After spending less than a year behind bars, Shepherd was released to a halfway house just weeks before the birth of her daughter. She remembers barely holding her newborn before the child was taken out of her hands. Years after her release, Shepherd recalls her children being taunted at school because of their mother’s label as a “baby killer.”

Innocence Canada, an organization that works to exonerate the wrongly convicted, helped overturn Shepherd’s wrongful conviction. In fact, over the last three decades, the organization’s pro bono work has helped exonerate a significant number of Canadians who have been wrongly convicted.

Win Wahrer, the cofounder of Innocence Canada, says she has seen a variety of factors that have resulted in wrongful convictions over the years. These include eyewitness errors, false confessions, or, as in Shepherd’s case, plea bargains.

Wahrer says wrongful convictions can also happen due to systemic issues like tunnel vision, jailhouse informants, and “junk science” – an epithet often applied to Dr. Smith’s faulty forensics. Despite the varied reasons that may lead to a wrongful conviction, what the cases have in common is that they are usually waiting games.

Although Shepherd’s wrongful conviction was overturned on appeal, sometimes appeals can serve to cement a wrongful conviction instead of correct it. In these rare cases, the wrongly convicted lose their appeals.

Recognizing this possibility for gross injustice, the Department of Justice has established a review process for people who have been wrongly convicted even after an appeal. These individuals can apply for ministerial review to get a new appeal or—in cases involving more egregious miscarriages of justice—a new trial.

According to the Department of Justice, “[w]hen an innocent person is found guilty of a criminal offence, there has clearly been a miscarriage of justice.”

Applicants seeking to have their case reviewed must show “important new information or evidence that was not previously considered by the courts” to prove a miscarriage of justice occurred. Sometimes this important new information is the result of DNA evidence or a witness with new details.

Steps to overturning a wrongful conviction after losing an appeal

While the road to exoneration may be long and winding, the destination is desolate. The last 15 years of data from the Department of Justice show that the vast majority of ministerial review applications are unsuccessful.

Innocence Canada has helped many individuals overturn their wrongful convictions via the ministerial review process and the courts. While a miscarriage of justice is not synonymous with innocence, Wahrer says, “Generally speaking, we believe the clients we take on are innocent. Not only that, you have to have substantial amount of evidence to convince the justice minister to reopen a case.”

Some cases could take years to compile new information before they are even submitted to the ministerial review process.

“We had a case since the 1990s, and we just submitted an application last year,” says Wahrer. “You have to make sure you have enough information, enough evidence, to support your claim on behalf of your client.”

Working for the Department of Justice, the Criminal Conviction Review Group (CCRG) is tasked with reviewing the cases, which could involve a variety of offenses under the Criminal Code. But Kerry Scullion, one of four lawyers that form the CCRG, says most of their cases are murders.

The current criminal conviction review process has been in effect since 2002. Scullion says he believes the current process was a response to the high-profile case of David Milgaard—who spent more than two decades behind bars before being exonerated—and other public inquiries into major miscarriages of justice.

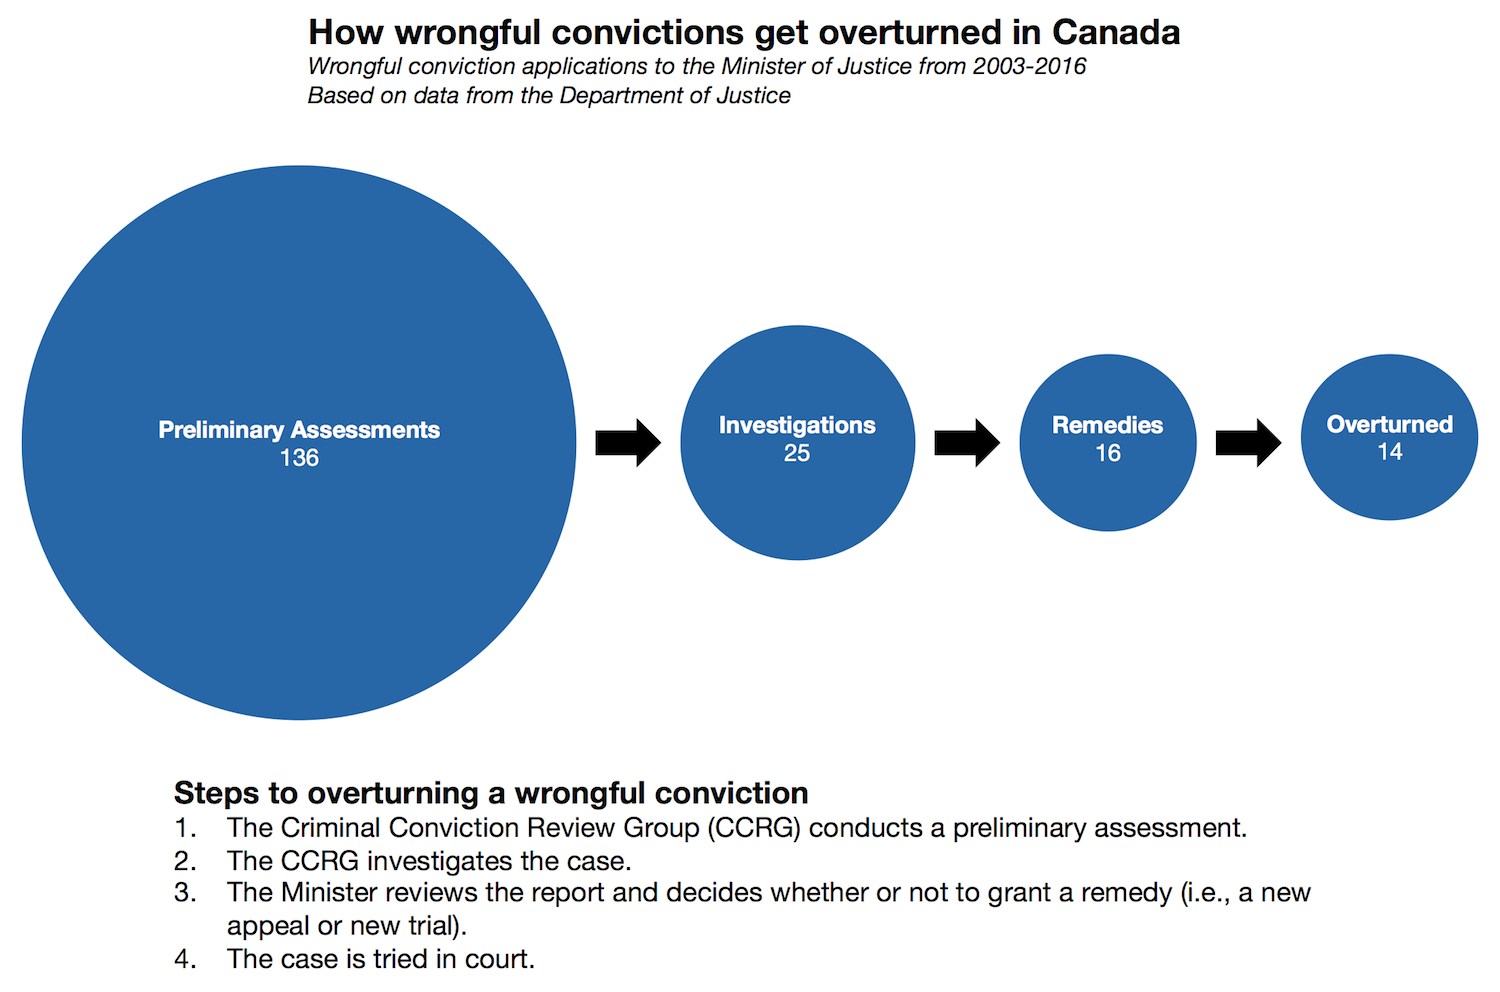
The road to overturning a wrongful conviction is a four-step process. A successful application will first undergo a preliminary assessment, then an investigation, followed by a recommendation from the CCRG, and finally, a decision from the minister. After these four steps, the case reenters the court system.

In order for a case to get a preliminary assessment, however, the applicant must submit “important new information,” or fresh evidence that was never considered by the courts to show they have been wrongly convicted.

Scullion explains that the preliminary assessment involves looking at the credibility of the new information and whether it would affect the outcome of the case, or as he says, determining “if there’s smoke.” For example, a case that relies on the testimony of a new witness with a long rap sheet may require more discovery at the preliminary assessment stage before the case is determined credible, says Scullion.

According to data from the Department of Justice, most cases fail to make it past the first stage. A total of 136 preliminary assessments have been conducted since 2002, but only 25 cases have made it to the next stage – the investigation stage.

How wrongful convictions get overturned in Canada

“Most cases don’t make [it] to the investigation stage because they have no merit for a variety of reasons,” says Scullion.

For the cases that make it to the second stage, Scullion explains, the investigations often involve “digging deeper” into the new information, which may include examining recanted witness testimony or new DNA evidence, especially for older cases where DNA testing was unavailable.

Yet despite the renewed popularity of shows like “Forensic Files” that portray DNA evidence as the holy grail of vindication data, Scullion cautions that DNA is only available in a small number of cases. “It’s not the panacea that it’s made out to be.”

The entire ministerial review process could be done in a matter of weeks, but the more serious cases take years, says Scullion, as the CCRG lawyers must wait for and dissect new information.

“These cases need to move faster than they’re moving,” says Wahrer, citing a current Innocence Canada client whose case has been in the ministerial review process for four years now. Unfortunately for the innocent, it can take a long time for potentially exonerating evidence to surface and to undergo a thorough investigation. In the meantime, applicants may be left in limbo.

After they complete their investigation, the CCRG prepare their report and present their recommendations to the minister, who then decides whether to grant a new trial or not. Out of the 28 cases that the minister of justice has reviewed since 2002, 16 trials have been granted, 14 of which resulted in the conviction being overturned; the remaining two cases are still before the courts—the last long step to overturning a wrongful conviction.

As for preventing major miscarriages of justice in the first place, Scullion says that police have implemented some new changes to prevent wrongful convictions, such as audio- and video-recording confessions.

But Wahrer believes more could be done to prevent wrongful convictions in Canada. “Most people involved with a wrongful conviction are rarely ever held accountable,” says Wahrer.

While it is impossible to know how many innocent people are behind bars in Canada, it is clear that wrongful convictions do happen, and for people who get a chance at exoneration, their cases often take a lot of hard work — and hard time — to reverse.

Although Shepherd’s case did not go through the ministerial review process, she understands the stress that comes with waiting for exonerating evidence while living with a wrongful conviction. “It doesn’t matter how much you try to have hope,” says Shepherd, “when you feel like your story’s never going to be listened to and nobody’s ever going to care about hearing the truth, your hope slowly dies.”

The biggest change for Shepherd since being exonerated is that she was able to become a licensed paralegal, a designation that her conviction had precluded.

Having lived half her life with a wrongful conviction, she now helps to spread the word through her advocacy work about how wrongful convictions can happen to anyone. “The system can take your freedom from you and you can allow it to destroy you,” says Shepherd. “Or you can take your experience, turn it into something positive, and work in the system to try and make corrections.”

The Most Bankable Stars Large

Who Are Canada’s Most Bankable Movie Stars?

Canadians have a long and storied history in Hollywood. Starting with some of the earliest silent film actors like Mary Pickford and Jack Carson all the way to 21st century stars like Ryan Gosling, Seth Rogen and Rachel McAdams, Canadian actors have played an outsized role in the film industry over the last 100 years.

So it was a natural question to ask which Canucks have generated the most in ticket sales by having their faces splashed across movie posters. Is it the veteran, celebrated actors like Donald Sutherland, whose classical training and polished baritone have offered gravitas (and commercial success) to over 65 films over the years, or comedic stars like Mike Myers, who has appeared in a relatively modest number of films, but manages to make almost every one of them a hit?

Every Dollar Counts

The first way we sliced the data was to consider the total box office draw (domestic plus international) for every film that an actor has appeared in, whether in a leading, ensemble or supporting role.

Actor Total Box Office Earnings ($)
Will Arnett 5.13B
Jim Carrey 5.01B
Seth Rogen 4.78B
Daniel Cudmore 4.54B
Donald Sutherland 4.49B
Cobie Smulders 4.47B
Mike Myers 4.44B
Keanu Reeves 4.38B
Peter Cullen 3.78B
Victor Garber 3.75B
Tara Strong 3.62B
Ryan Reynolds 3.60B
Christopher Plummer 3.23B
Dan Aykroyd 3.10B
Rachel McAdams 3.10B
Colm Feore 2.96B
Jay Baruchel 2.84B
Jason Whyte 2.78B
Evangeline Lilly 2.74B
Cameron Bright 2.72B

Surprisingly, the Canadian who comes out on top is Toronto-born comedian Will Arnett, perhaps most famous for his supporting role in the television series Arrested Development. But it turns out, the man has appeared in a large number of high-grossing films too, particularly as a voice actor in animated movies like Despicable Me, The Lego Movie and Ratatouille. With Canada’s reputation as a hotbed of comedy, funny guys like Jim Carrey, Seth Rogen and Mike Myers fill out many of the top spots, on the backs of blockbusters like Ace Ventura, Knocked Up and Austin Powers, respectively.

But look closer at the list, and a few actors who are not quite household names stand out. Daniel Cudmore, a stuntman and actor from Squamish, British Columbia, has appeared in films grossing over $4.5 billion (US), but most Canadians wouldn’t be able to pick him out of a lineup. How can this be? Cudmore’s filmography reads like an encyclopedia of big budget, ensemble dress-up films, including franchises like X-Men (where he plays the metal-armoured Colossus) and the Twilight series (where he plays vampire Felix).

Unknown actor Jason Whyte may be the most unexpected Canadian thespian to grace the silver screen. With an otherwise bare film resume, Whyte managed bit roles in two of the highest grossing films of all time, Avatar and King Kong, putting him in the company of much more accomplished actors — at least in this ranking.

In the Lead

Clearly, just appearing in a movie may not be the most appropriate definition of a bankable actor. After all, the economics of Hollywood are very much star-driven. To address this, we next look at actors’ box office gross when they appear in a leading role; The Numbers defines an actor as having a leading role if they appear on the film’s theatrical poster and there are four or fewer total actors on the poster.

Actor Number of Films as Lead Box Office Earnings as Lead ($)
Jim Carrey 27 4.58B
Mike Myers 12 4.08B
Keanu Reeves 34 3.78B
Ryan Reynolds 18 2.09B
Michael J. Fox 19 1.82B
Hayden Christensen 8 1.81B
Seth Rogen 15 1.77B
Brendan Fraser 10 1.58B
Rachel McAdams 14 1.23B
Ellen Page 11 1.10B

In this version, we start to see a listing of those actors we may intuitively consider to be the biggest Canadian stars of today and of the past few decades. Gone are supporting actors like Will Arnett, Cobie Smulders (The Avengers) and Jay Baruchel (She’s Out of My League), and in are leading names like Michael J. Fox (Back to the Future) and Brendan Fraser (The Mummy). Jim Carrey, who rarely appears in a film if he’s not the lead, tops this ranking, while Keanu Reeves, whose star turn in over 30 films, ranging from The Matrix series to Bill and Ted’s Excellent Adventure, has brought in over $3.7B in ticket sales.

By the Movie

Jim Carrey and Keanu Reeves have the benefit of longevity, so perhaps it is unfair to compare them to stars who have only headlined a handful of films, but every one of those was a huge hit. Finally, we consider the box office draw of actors in leading roles on a per film basis.

Actor Number of Films as Lead Box Office Earnings as Lead Per Film ($)
Mike Myers 12 340M
Kim Cattrall 3 237M
Hayden Christensen 8 226M
Taylor Kitsch 3 197M
Rick Moranis 3 194M
Will Arnett 6 176M
Jim Carrey 27 169M
Brendan Fraser 10 158M
Carrie Anne Moss 4 126M
Nia Vardalos 3 125M

Some unexpected faces now appear. Kim Cattrall, who has been a reliably sharp and quick-witted supporting cast member in dozens of film and TV roles, hit it out of the park in her three star turns, two of which reprised her Sex and the City character Samantha Jones. Up-and-comer Taylor Kitsch has flown somewhat under the radar while starring in blockbusters Battleship and John Savage, while Nia Vardalos can owe her appearance on this list exclusively to her role in the play-turned-megahit My Big Fat Greek Wedding, which became the highest grossing romantic comedy in history.

Methodology

Data was provided by The Numbers, a comprehensive database of box office business, and is accurate as of April 2017. We consider both domestic and international box office figures in our analysis.

To determine whether an actor has a leading role, The Numbers uses a simple rule: does the actor appear in the movie’s theatrical poster? If there are more than four cast members on the poster, then all actors are classified as being lead ensemble members, which we do not count as leading in this analysis. Otherwise, the actor’s role is classified as being supporting, cameo or other.

Finally, a comprehensive list of Canadian actors was drawn from IMDB, with some manual curation to fix a small number of errors among the the highest grossing actors.

Don't miss our newest maps, charts and stories. Sign up now to have them delivered to your inbox.

Miserable Bills Fans

The Most Miserable Sports City – 2017 Edition

UPDATE: Check out our 2018 ranking of the most miserable sports cities!


It may seem like a bit of a let down this year in the world of sports misery. Numerous epic streaks of futility have been washed away, leaving formerly hopeless fans with unfamiliar and uncomfortable feelings of giddiness and pride. Cleveland breathed a 52-year sigh of relief after prodigal son Lebron James made good on his promise to bring the city its first championship since 1964, beating the seemingly unstoppable Golden State Warriors in a thrilling 7-game final. The Chicago Cubs, who since the waning days of the Ottoman Empire had turned losing into an artform, finally dismantled the Curse of the Billy Goat in a heart-stopping 7-game World Series clash against the Indians. In Toronto, fans have emerged from a decades-long period of misery and failure with something to actually cheer for: a group of exciting and moderately successful teams in the Raptors, Blue Jays and Maple Leafs.

But don’t fret, sports fans. There is still plenty of misery to go around. We just had to look a bit further this time. In years past, we focused on major North American sports cities with at least three teams in the big four leagues (baseball, basketball, football and hockey). However, this year, we’ve extended our gaze to include cities with two major franchises. And boy, we’re glad we did, because there are some hurting fans in these smaller market towns who deserve our respect and pity for their unflinching loyalty.


Link to What is the Most Miserable Sports City 2017 Chart


Link to What is the Most Miserable Sports City 2017 Chart

As in our previous rankings (2016, 2015), we weighed playoff appearances, playoff series wins, and championships when calculating a city’s Misery Score. We also relied heavily on recent success, since there’s no better way to forget a drought than with a lot of winning. See the Appendix for details on our scoring system and clustering choices.  

1. Buffalo

You thought being a sports fan in Cleveland used to be tough? Buffalo fans have never tasted the glory of an NFL or NHL championship, despite having had the Bills since 1960 and the Sabres since 1971. They also were home to the NBA’s Buffalo Braves from 1970-1978, but that franchise quickly moved west, where it eventually turned into the Los Angeles Clippers (who still haven’t won a championship). The Bills present a particularly painful lesson in futility. Appearing in four straight Super Bowl finals in the early 1990s, the team somehow managed to lose each one. While most of the losses were embarrassing blowouts (that 52-17 massacre in the 1992 season being particularly wrenching), Scott Norwood’s missed field goal in the waning seconds of Super Bowl XXV forever imprinted Wide Right on the mind’s of Buffalo sports fans, and inspired Ace Ventura’s infamous “Laces Out” joke. It hasn’t gotten much better lately, either. Since the year 2000, they’ve only had two winning seasons, and own the NFL’s longest active playoff drought.  

The Sabres have been quite the sad-sack NHL franchise for the past decade, but actually had a reasonable run in the 1990s and early 2000s, culminating in a dramatic trip to the Stanley Cup Finals in 1999. With the series on the line against the Dallas Stars, the two exhausted clubs fought their way into triple overtime. Future Hall-of-Famer Brett Hull scored a controversial game-winning goal, with his toe dipping into goalie Dominik Hasek’s crease before the puck entered the net (which was illegal at the time). With the blunt, stone-faced coach Lindy Ruff at the helm for 15 seasons, the Sabres have never recovered.

2. Cincinnati

It was a tight race to the bottom between Buffalo and Cincinnati. But memories of the Reds’ World Series win in 1990 makes life as a sports fan in The Queen City slightly less miserable. Just slightly.

The Reds have been mostly terrible for the past 25 seasons, save for a small stretch in the early 2010s. Things have gotten so dire for the club that various studies have shown that the team’s pitching staff last year was perhaps the worst of all time. It doesn’t get much worse than that for a baseball club, unless of course you consider the team’s longtime former owner, Marge Schott, known for her racist comments toward African-Americans, Asian-Americans and Jews, and open praise for Adolf Hitler. On the baseball front, her ever-present St. Bernards were known to frequently relieve themselves on the field of Riverfront Stadium, while her distaste for scouts most certainly hindered the the franchise’s development into a more successful baseball club.

In football, the Bengals have never won a Super Bowl, and have subjected their fans to humiliating defeats in their past seven playoff games (that’s 27 years without a playoff game win). In 2015, the team suffered the ultimate meltdown, committing two boneheaded penalties to give the Steelers a chip shot field goal for the win.

Cincinnati fans: we salute you.

3. Minneapolis-St. Paul

This year, the Twin Cities have the dubious distinction of being the most miserable among major sports cities (those with 3 or more teams), after teams from cities like Cleveland, Toronto and Houston broke major playoff droughts.

While this city’s franchises are not necessarily the worst in their respective leagues, they are not particularly good, either. The Vikings, Timberwolves and Twins suffered through another season without making the playoffs, while the Wild, who have shown flashes of brilliance in the past several years, are nevertheless not in the discussion for a potential Stanley Cup. Case in point: for much of this past season, the Wild were playing like the presumptive Presidents’ Trophy winners, but a late-season skid has their fans doubting whether they’ll even make it past the first round of the playoffs. Minnesotans have to be wondering: is this as good as it gets?

4. Queens – Long Island

New York City’s “little brother” teams — the Jets, Mets and Islanders, who share a historical fan base in Queens and Long Island — have actually given their supporters a little something to cheer about in recent years. The Mets have become a formidable club in the National League, with an ace pitching staff that includes Noah Syndergaard, Matt Harvey and Jacob deGrom. The New York Islanders are resurgent under the leadership of superstar captain John Tavares, winning their first playoff series (in 2015) in over two decades, though they look to be missing out on the postseason this year. The Jets, in the post-Rex Ryan era, had a breakout 2015, but followed it up with a humdrum 2016.

But despite some signs of life at Shea Stadium and the Barclays Center, these fans have nevertheless suffered through a 30-year championship drought, the most of any major sports city. So when it comes to misery, New York’s fiercely proud little brother fans have it in spades.

5. Atlanta

For a second straight year, Atlanta just slips into our list of the top five most miserable sports cities. But things could have been much different this year. Just ask any Atlanta football fan about Super Bowl LI and you’ll immediately see a pained and heartbroken expression on their face. During that championship game, the Falcons were running up the score against the New England Patriots, leading by an enormous 25 point margin in the 3rd quarter, yet somehow managed to fritter away their lead to lose 34-28 in overtime. It was the team’s best opportunity to win its first Super Bowl title, and one that will not be soon forgotten by its hardy fan base.

In baseball, the Braves used to be something of a model organization, winning their division an eye-popping 14 seasons in a row through 2005. But that gaudy streak produced only a single World Series title for the Big Peach, which has to gnaw on even the most faithful Braves fans. With fewer than 70 games won in each of the last two seasons, the Braves have a long rebuild ahead. Hey, at least they have a beautiful new stadium, right?

As for the Hawks, they can be summed up with an emphatic “Meh”. They’ve fielded a pretty average team over the past decade, and managed to waste a promising 60-win season in 2014-15 by being summarily swept by the Cavaliers in the Conference Finals.

Honorable Mention: San Diego

Finally, a special shout-out to San Diego, who didn’t even qualify for our rankings this year because they only have one team remaining in their city. After the Chargers picked up and left for LA, San Diegans have only the Padres to root for, which is just sad. Denizens of the city haven’t been able to celebrate a championship since 1963, when the Chargers won the AFL championship.

Which city do you think deserves to be in the top 5? Follow us on Facebook or Twitter and join the discussion.

Methodology Notes

Cities with Multiple Teams

Several large cities in North America have more than one professional team in the same league. To handle these cases, we divided fans up into natural allegiances, and calculated separate misery scores for each set of fans. Chicago is an easy one: one set of fans supports the Cubs (Chicago A), while the other supports the White Sox (Chicago B). Los Angeles is similar, with those supporting the Clippers (Los Angeles A) and those supporting the Lakers (Los Angeles B). 

The San Francisco Bay Area has two football teams and two baseball teams (and a single basketball and hockey team). Those in the East Bay typically back the Raiders and Athletics (San Francisco Bay Area A), and those in San Francisco and the peninsula back the 49ers and Giants (San Francisco Bay Area B). 

Then, there is the complexity of New York City. There are of course many exceptions to the clustering that we selected, but generally speaking, we have the “big brother” and “little brother” teams of New York. The Rangers and Knicks (who both play in Madison Square Gardens), along with the Yankees and Giants, have a somewhat consistent fan base. Similarly, the Jets and Mets (who shared Shea Stadium in Queens), along with the New York Islanders (who are originally from neighboring Long Island), tend to share fans based on geography and a common history (Queens-Long Island). We omitted from our analysis the New Jersey Devils, as well as the Brooklyn Nets, who may still be finding a consistent fan base after moving from New Jersey.

Finally, we note that several NFL franchises are on the move. San Diego lost its Chargers to Los Angeles this year, so San Diego is not included in the rankings (as it has only a single franchise). St. Louis lost its Rams last year, also to Los Angeles; we decided not to include the Rams in the Los Angeles calculations because it is such a new franchise to the city. The Raiders have also decided to move homes, from Oakland to Las Vegas. However, the final move is not scheduled until 2019, so the frenetic Raider Nation can still cherish their heroes for a few more years.

The Misery Score Explained

We first compute a misery score for each team, as follows: a team gets a demerit point for each year since (i) it last made the playoffs, (ii) it last won a playoff series (which doesn’t include MLB play-in game wins), and (iii) it last won a championship. We cap each of the three above point values at 30, because the average fan’s age in the major sports is approximately between 42 and 43, and the age of 12 or 13 is the general age of enlightenment when fans start to really understand sports (and the misery that comes with losing). These points are added together, which gives each team a number of points between 0 (if the team won a championship last season) and 90 (if the team hasn’t made the playoffs in the past 30 years); we then normalize these values onto the [0,100] scale, to get a team-level misery score.

Finally, for each city, we take a simple average of its component teams’ misery scores, to get an overall city-level misery score. For ease of interpretability, we bucket these city scores into 4 categories: green (0-15), yellow (15-30), orange (30-45) and red (45+). Green means that you only need to look back, on average, about 5 years to see a lot of success (Boston); yellow look back 10 years (Tampa Bay), orange look back 15 years (Washington, Philadelphia and Phoenix), and red over 15 years (Buffalo and Cincinnati).

Note that we have only chosen to display NFL champions since the first Super Bowl (in 1967). Teams with their last win prior to that (ex. Detroit) are marked as “NA” in our graphic.

Don't miss our newest maps, charts and stories. Sign up now to have them delivered to your inbox.

Filmores Hotel Large

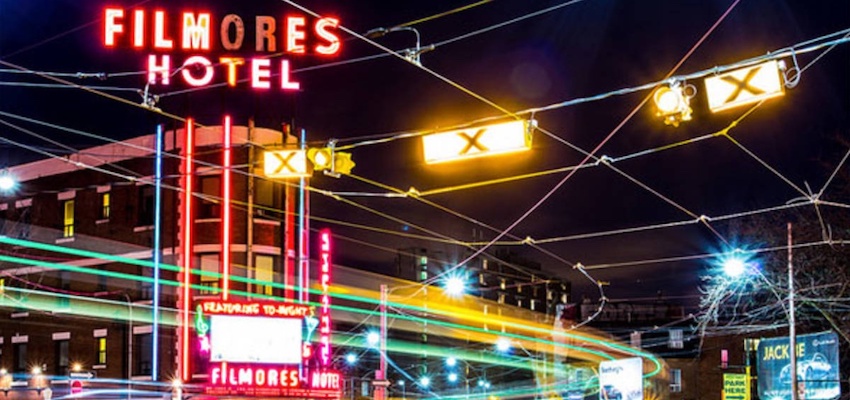
Exit Stage Left: The Decline of Strip Clubs in Canada

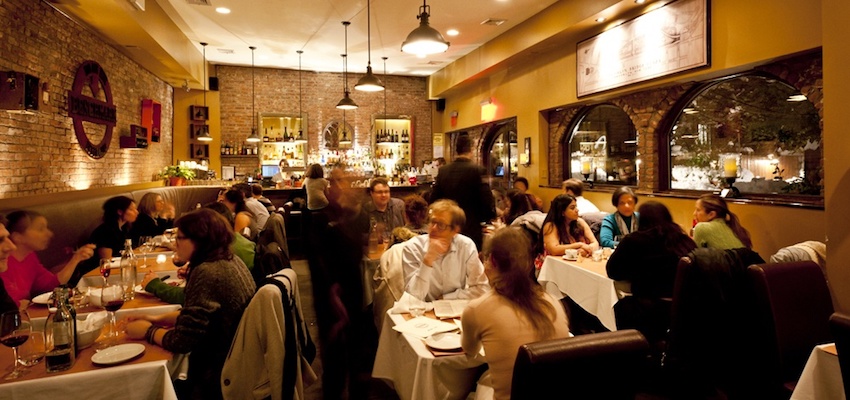
Today, one of the largest strip clubs in Etobicoke, the westernmost borough of Toronto, has become a gourmet burger restaurant. The vestiges of its past as a bar where men would visit to watch scantily clad women and drink beer have been replaced by family-friendly menus and waiters dressed in t-shirts and jeans, while the blacked-out windows have given way to an open, airy interior.

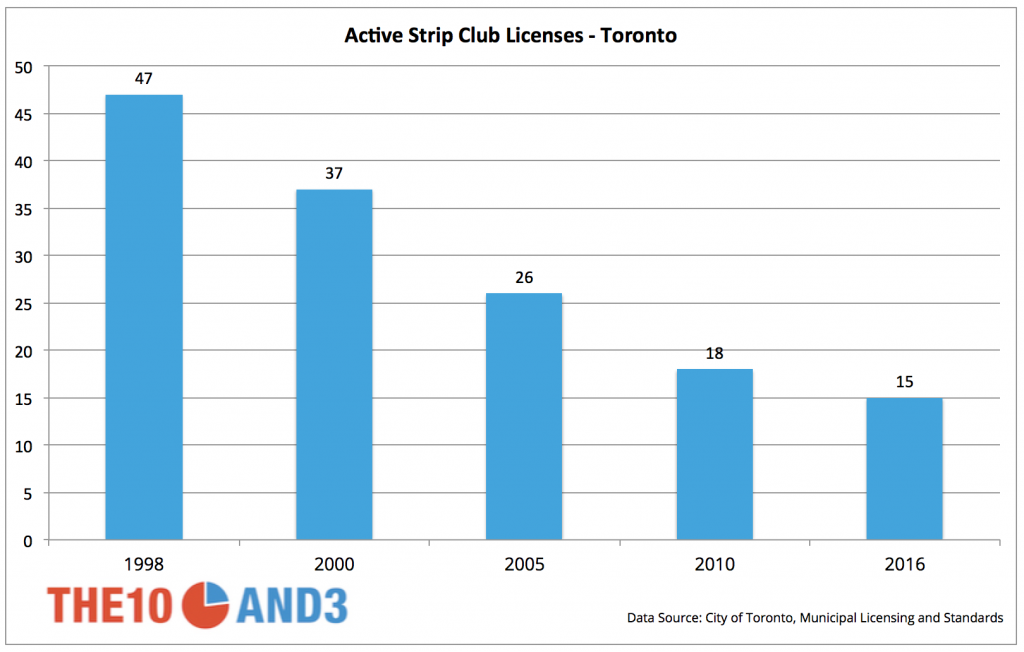
The story is the same in many places across English Canada. Strip clubs were formerly a mainstay of Canadian life, frequented by groups of younger men out on the town, and older men looking to blow off steam after work. But today, the story is bleak for the once thriving industry.

The Numbers

The clubs tend to fall into two broad categories. There are the downtown clubs, such as the Brass Rail on Yonge Street in Toronto, popular with tourists and bachelor parties, and those in the suburbs, often in unassuming strip malls and featuring ads for food and drink specials on the front door. While the downtown clubs are certainly in decline, this second group has been hit even harder by changes in law, demographics, and culture that have widely put the entire industry on a downhill trajectory. The industry group overseeing strip clubs, the Adult Entertainment Association of Canada (AEAC), evaporated within the last year amid infighting and a rapidly changing environment.

Across Ontario, there are fewer strip clubs than ever before. Toronto has seen the starkest downturn. In 1998, the first year after Toronto’s amalgamation, there were 47 active strip club licenses within the city. Today, only 15 remain – and they operate out of just 13 buildings. This experience has been mirrored across the country as some cities have seen their strip clubs wiped out completely.

Active Strip Club Licenses - Toronto

The Law

Canada has had a checkered history with strip clubs, and some of the most vigorous constitutional debates have stemmed from their operation. Starting with Canada’s first completely nude strip club, the aptly-named Pandora’s Box in Ottawa, litigation over the right of these clubs to operate ran throughout the 70s and 80s. The courtroom debate centred around just how much patrons can see – and touch. Today, the law stands that stripping is constitutionally acceptable, but provinces and cities can regulate strip clubs via nuisance laws.

This has led to some extreme situations. In Saskatchewan, the legislature has flip-flopped on allowing licensed strip clubs to exist at all. The province had previously never legally permitted strip clubs wherever alcohol is served, but decided to give it a shot in 2014. During the small window of legalization, strip performances were permitted twice per month at certain bars, and required frequent police checks and screening processes.

Historically, without specific clubs in the city, Saskatoon would issue licenses directly to each dancer, who were required to keep them during their shifts. In 2014, when stripping was legal, the number of licenses in Saskatoon ballooned to 53, for the city of 222,000.

But less than two years later, Saskatchewan quickly re-enacted its ban, citing a fear of increasing organized crime and exploitation of young women. By the end of 2015, only five licenses remained valid. The political drama created an uproar in Saskatoon, the province’s largest city. These days, the only time stripping is legal in Saskatchewan is for a charity event.

“I’m very unimpressed with the way people view the industry, and the way they see us,” said Tokyn Thompson, a current dancer and the former owner of the Tiger Lily Cabaret in Saskatoon. “We’re still educated, intelligent, and still human, and it was really hard reading what people say about you, and what people assume about you.”

Thompson was among an industry group that fought the ban’s reinstatement. After multiple hearings and meetings, the law was eventually changed to rein in stripping in the province. Consequently, Thompson’s performances in bars had to stop, and she was also barred from performing at private parties, previously the lifeblood of her business.

“We had a good thing going on and we were working with the police. [Proponents of the change] were using a lot of hot-button words like child exploitation and human trafficking, but it was good, we kept underage girls out of the industry,” said Thompson. “I’m not a mob boss, I own a company, and I was the only game in town.”

“The thing is, when you can only do it for charity, and it’s so heavily regulated, then it’s no longer an industry,” added Thompson, who has been forced to find new work after deciding to stay in Saskatoon. Other performers have uprooted their lives completely for Manitoba or Alberta.

While Saskatoon stands as an extreme example, a checkerboard of laws and regulations, at the municipal, provincial and federal levels, govern the operation of these clubs around the country. Occasionally, the results are laughable. Manitoba laws state that dancers must have the majority of their buttocks covered when not dancing on the main stage. Toronto requires all strip club managers to be “neat and clean in his or her person and civil and well-behaved.” London, Ontario, specifically disallows any more than four strip clubs from operating within the city.

The Business

But the laws are serious business, and they have barred the industry from recruiting new talent, operating close to residential neighbourhoods, and in some cases, turning a profit.

“Strip clubs are in decline. It’s not a good business anymore. It was a good business, but not as much now,’ said Spiro Koumoudouros, owner of both the House of Lancaster and House of Lancaster II, in Toronto. Koumoudouros is among the last businessmen who own multiple clubs in the city.

While Toronto’s clubs have not fared well, other smaller markets have faced unique challenges relating to the patchwork of laws each province operates under.

“Our liquor laws [in Manitoba] say you need to have a hotel before you can have a strip club,” said Rick Irving, founder of Superb Entertainment, which books dancers throughout Manitoba and Northwestern Ontario. “When we started the business 50 years ago, every hotel had dancers.”

Irving estimates that there are over 100 hotels in Manitoba that were booking his dancers. He says that even in the large area he works from, business has dropped off precipitously within the last decade.

Circumstances are just as tough in smaller Ontario markets too. In 2000, London, Ontario had six operating strip clubs. Sixteen years later, only three clubs still operate for the city of 475,000 after one club had its liquor licence revoked for potential ties to southwestern Ontario biker gangs.

Strip club owners have in the past attempted to band together to lobby all levels of government for more favourable regulations. However, its industry group, the Adult Entertainment Association of Canada (AEAC), folded within the last year due to infighting and economic pressures.

Koumoudouros, particularly, has trouble attracting new employees to work for him, and he sees this as the result of both federal and municipal policies working against him. The two prongs of law and policy stem from changes to federal immigration procedures, and the evolution of a more permissive attitude towards massage parlours.

If someone wants to become a stripper in Toronto, they need to go through a police background check, and their position as a stripper will re-surface on future background checks. As with other service industry work, like bartending and pouring lattes, few intend on stripping for an extended period of time. The legal implications mean that few locals are willing to select this work over other service industry positions.

“The only way this business can survive is if the federal government allows us to import entertainment,” says Koumoudouros. “The federal government stopped allowing work visas … There are no entertainers – people can’t watch the same, the same, the same.”

Koumoudouros also claims that legitimizing body rub parlours – colloquially known as “rub and tugs” – have attracted the labour pool elsewhere. Today, the operators of these establishments can receive licensing from the city and operate as a business under similar bylaws to strip clubs.

“Massage parlours have always been an even thornier issue than strip clubs,” said Rudi Czkella-Martinez, a former consultant with the AEAC and author of several reports on the state of municipal zoning within the Adult Entertainment Industry. “The strip club industry doesn’t get along with the body rub community. Strip clubs have always argued that they shouldn’t be allowed, and that they’re brothels.”

Throughout the last 25 years, zoning regulations have forced new strip clubs to open in industrial areas, away from residents and similar businesses. Meanwhile, massage parlours, escort services, and online entertainment flourish closer to home. In today’s environment, if you want to visit a strip club, you need to work to get there.

So who, exactly, is still willing to do just that?

The People

One would assume, with an aging male demographic in Canada, that strip clubs wouldn’t have any issue filling their bar stools. But as the laws have changed and more edgy, sex-driven businesses have opened up, competition for this sort of money has become fierce.

“Strip clubs are almost like quaint businesses now,” lamented Czkella-Martinez. “They hit their heyday in the 80s, back when they were seedy and edgy, and now it seems that they can’t compete. You sit there, you order a beer, and you see who’s around. It’s not like in the 80s when it was crazy.”

Perhaps the biggest incoming threat to the business model is coming from online pornography. The porn industry worldwide has been valued at $97 billion, a bigger entertainment market than the three largest North American professional sports leagues combined. The breadth of video, photography, and interaction online lets consumers find precisely what they’re looking for, and in some cases, the interaction from within the home creates an environment similar to what would be found at the neighbourhood strip club.

“The general feeling is that it’s mostly men using these sites, and websites cater to them, but it’s sort of a chicken-and-egg problem,” said Patrick Keilty, a professor at the University of Toronto who studies the information technology of online pornography. “There’s a privacy element, and that creates a kind of comfort. Things like porn, dating apps and online escort services allow for people who would otherwise be shy to do these things from home.”

While this sort of experience can be found at anyone’s fingertips, it remains unclear whether users of online porn are identical to those who used to frequent strip clubs. The largest online porn companies, like PornHub, collect vast tracts of user data about who frequents their network of sites, but that data remains largely proprietary and it remains difficult from a statistical standpoint to parse out demographic data from this information.

“Companies like PornHub are really a medium-sized tech company,” said Keilty. “They’re not just interested in where you go on their site, but where you go after as well … it’s driven heavily by advertising.”

Although the online world can approximate the experience of seeing a stripper live, it’s still not a perfect substitute. It’s unsurprising, then, that porn theatres have gone extinct far faster than even strip clubs; the last remaining porn theatre in Toronto recently closed, and the space was quickly replaced by a rock climbing gym.

“To be quite honest, the impact of zoning and licensing haven’t been as great as people would think,” said Czkella-Martinez. “A lot of the reason why these businesses have been going down and down is what’s going on in society in general.”

The public’s perception of strip clubs hits home especially for Koumoudouros, the Toronto club owner, who saw deliberate attempts to remove him from chairing the board of the business improvement area in his neighbourhood.

Strip clubs are not necessarily dead, in fact, but are instead working on adapting to new clientele. The best example of this adaptation can be found in Edmonton. Unlike the prohibitionist approach adopted by its provincial neighbour to the east, Edmonton strip clubs have continued to press onward. Only one strip club license has been outright cancelled within the last decade. While clubs are closing every year in Toronto, two of them opened in Edmonton in 2013. Meanwhile, Pinky’s Show Theatre recently took over another strip club, and re-launched this March, making it the newest strip club in Canada.

Successful clubs are relying less and less on the shock value of its entertainment. Instead, they’re attempting to re-focus as a party atmosphere, with the dancing girls serving as a backdrop and a part of a larger nightclub.

Nevertheless, it remains to be seen if they can survive outside the tourist campiness on Toronto’s Yonge Street or Montreal’s Saint Catherine Street. It seems strange to lament the loss of an industry that so many have derided over the course of history, but for many, the strip club world served as a livelihood, work experience, and sometimes, even great memories.

“There wasn’t a ton of us in Saskatchewan, so we all became a family,” reminisced Thompson, recently speaking from a bus to Winnipeg to perform there once again. “I miss it.”

Don’t miss our newest stories! Follow The 10 and 3 on Facebook or Twitter for the latest made-in-Canada maps and visualizations.

Don't miss our newest maps, charts and stories. Sign up now to have them delivered to your inbox.

Toronto's Top Restaurants

The Best Restaurants in Toronto – What the People Say

Though Toronto’s food scene is thriving, it remains an up-and-comer when compared to the great dining hubs of the world, with no Michelin guide or world top 50 restaurants to speak of yet. But for food lovers in the know, the city already has all of the ingredients to make it a formidable culinary destination: amazingly diverse cuisine, an opulent high-end, a delicious low-end, and a growing farm-to-table and slow food movement. It’s all there, so if you’re hungry, you’ve come to the right town.

But when it comes to finding Torontonians’ favourite place to chow down, there is no easy answer. Top critic lists tend to favor trendy spots like Drake One Fifty and Bar Isabel, and typically focus on a few downtown neighbourhoods well south of Bloor Street. But it’s a big city out there, with a whole lot of food to the east, west, and even in the suburb strip malls way up north.

So how to sort through the dizzying multitude of neighborhoods, cuisines and price levels that Toronto’s restaurant scene serves? To answer this question, we look at the great equalizer in restaurant reviews: Yelp. Anyone can go online and contribute a review, and refreshingly, the voice of any old hungry John Q. Public from North York or Mississauga or Cabbagetown counts just as much as that of The Globe and Mail’s esteemed restaurant critics. (Certainly, Yelp has its detractors, with worries of fake or spammy ratings, but Yelp now aggressively combats this practice to keep its ratings as reliable as possible). We considered every restaurant in the Greater Toronto Area with a Yelp listing as of December 2016 and statistically adjusted their rating for popularity, so that the more people that submitted reviews, the more confident we can be about the rating.

Toronto’s Top 50 Restaurants

Rank Restaurant Adjusted Rating Cuisine
1 Muncheez 4.55 Crepes
2 Under The Table Restaurant 4.42 Caribbean
3 Blaze Fast 4.32 Pizza
4 Jacobs & Co. Steakhouse 4.32 Steakhouse
5 Seven Lives Tacos Y Mariscos 4.31 Mexican
6 Mystic Muffin 4.31 Sandwiches
7 Corrado’s 4.3 Italian
8 Richmond Station 4.29 Canadian
9 Yasu 4.28 Japanese
10 Kaiju 4.28 Asian Fusion
11 Byblos 4.25 Mediterranean
12 Fresco’s Fish & Chips 4.22 Fish & Chips
13 George 4.21 Canadian
14 Scaramouche Restaurant Pasta Bar & Grill 4.21 French
15 Alo Restaurant 4.21 French
16 Pai Northern Thai Kitchen 4.19 Thai
17 Banh Mi Boys 4.19 Vietnamese
18 Agio 4.18 Italian
19 Café Polonez 4.18 Polish
20 Black Camel 4.17 Sandwiches
21 Black Hoof 4.16 Gastropub
22 Ravi Soups 4.16 Soup
23 Nuit Social 4.16 Modern European
24 Levetto 4.15 Italian
25 Tibet Kitchen 4.15 Himalayan/Nepalese
26 Pearl Diver 4.14 Seafood
27 Emma’s Country Kitchen 4.13 Breakfast & Brunch
28 Dac Biet Burger 4.13 Burgers
29 Chris Jerk Caribbean Bistro 4.13 Caribbean
30 The Pie Commission 4.13 Canadian
31 Hibiscus 4.13 Vegan
32 Sushi Wa 4.11 Sushi
33 Rasta Pasta 4.11 Caribbean
34 Rasa 4.11 Canadian
35 The Elm Tree Restaurant 4.09 Mediterranean
36 Huevos Gourmet 4.09 Mexican
37 KINKA IZAKAYA ORIGINAL 4.09 Japanese
38 Frank’s Kitchen 4.08 French
39 The Hole In the Wall 4.08 Canadian
40 Boralia 4.07 Canadian
41 One2 Snacks 4.07 Malaysian
42 Ay Caramba, Eh 4.06 Mexican
43 The Fuzz Box 4.05 Sandwiches
44 Memphis BBQ 4.05 Barbeque
45 Salad Days 4.05 Salad
46 Sunny Morning 4.05 Breakfast & Brunch
47 Antler Kitchen & Bar 4.05 Canadian
48 Kintako Japanese Restaurant 4.05 Japanese
49 La Bella Managua 4.04 Latin American
50 Tofu Village – House of Soon Tofu 4.04 Korean

What is most striking about a list that focuses only on diners’ ratings is the remarkable diversity of favourite restaurants. At the top of the rankings, we have Markham’s hidden gem, the creperie Muncheez. Tucked away inside an unassuming strip mall just north of Steeles, between a nail salon and optical shop, is by far the most highly rated restaurant in all of the GTA. Serving crepes both savoury and sweet, Muncheez has managed to establish a rabid following with little of the critical attention often required for success.

In second is perhaps another surprising selection, at least to those not familiar with Cabbagetown’s rich tapestry of down-home, unpretentious restaurants. Under the Table, a modest Caribbean spot described by some as Cabbagetown’s “community restaurant,” features a growing menu of affordable dishes like jerk chicken and oxtail; essentially, everyone who is lucky enough to stumble upon this gem simply loves it.

Further down the list are some of Toronto’s most well-known, delectable and upscale, dining hotspots, like the celebrated steakhouse Jacobs and Co., the sophisticated French haute destination Scaramouche, and continental Richmond Station, led by former Top Chef Canada winner Carl Heinrich. Trendy and sumptuous spots further fill out the list, including the Trinity Bellwoods darling Black Hoof, fledgling Italian chain Levetto, and the theatre district’s popular and affordable Pai Northern Thai Kitchen.

But what’s a good list without more surprises far from the beaten path? Yelp ratings have honed in on a few more hidden gems in Toronto’s sprawling reaches. Vaughan features Ay Caramba, Eh, a popular restaurant focusing on modern Mexican street food, while Woodbridge offers a surprisingly delicious outpost of southern cuisine at Memphis BBQ in a no-frills roadside shack. Just missing our top 50 cut is Scarborough’s Shawarma Empire, a humble, friendly and always crowded spot that many patrons argue has the best shawarma in the city.

Top Restaurants by Cuisine

Cuisine Restaurant
Asian Fusion Kaiju
Barbeque Memphis BBQ
Breakfast & Brunch Emma’s Country Kitchen
British The Queen and Beaver Public House
Caribbean Under The Table Restaurant
Chicken Wings Fanzone Wings & Ribs
Chinese Ho Ho Bbq
Diners Avenue Open Kitchen
French Scaramouche Restaurant Pasta Bar & Grill
German Wvrst
Greek Pantheon
Indian Indian Grill
Italian Corrado’s
Japanese/Sushi Bars Yasu
Korean Tofu Village – House of Soon Tofu
Mexican Seven Lives Tacos Y Mariscos
Middle Eastern Byblos
Pizza Blaze Fast
Steakhouses Jacobs & Co. Steakhouse
Thai Pai Northern Thai Kitchen
Vegeterian/Vegan Hibiscus
Vietnamese Banh Mi Boys

Methodology

Yelp data was collected in early December 2016, for all restaurants in the Greater Toronto Area with at least one rating on Yelp. Basic filtering was done to remove establishments whose primary purpose is not the sale of food (ex. bars), and cuisine categories were drawn from Yelp’s categorization, with some light manual editing.

Yelp data is by no means a perfect measure of how well real restaurant-goers like an establishment. Besides the fake review issue mentioned above (by a jealous competitor, for instance, or a restaurant’s owner herself), there is the concern that Yelp reviewers are not representative of the public at large (they skew young, tech savvy and live in big cities). There is also the herding effect, where raters are influenced by existing ratings for an establishment, and the occasional instance of ratings driven by revenge or other agendas.

While this is all true to some extent, the service has become such a popular and democratizing vehicle that the data simply cannot be ignored; it drives thousands of dining decisions in Toronto daily, and provides one of the clearest pictures of the public’s sentiment toward a restaurant that exists.

The adjusted ratings were computed according to the following standard Bayes’ rating formula, which is a common technique used to adjust ratings for confidence:

adjusted rating = (v/(v+m))R+(m/(v+m))C,   where

  • R = average Yelp rating for the restaurant
  • v= the number of Yelp ratings that the restaurant received
  • m = parameter that effectively downweights restaurants with very few ratings (in our case m = 50)
  • C = average rating across all restaurants in our ranking.

The purpose of the adjusted ratings is to make sure that a highly rated restaurant with only a few five star ratings on Yelp does not receive an inflated ranking. It ensure that the more Yelp ratings that a restaurant has, the more confident we are in its score. With relatively few ratings, we revert a restaurant’s score back toward the overall mean. This technique is used, for example, in IMDB’s top 250 lists, as well as our previous Canadian movie and Canadian book rankings.

Don’t miss our newest stories! Follow The 10 and 3 on Facebook or Twitter for the latest made-in-Canada maps and visualizations.

Don't miss our newest maps, charts and stories. Sign up now to have them delivered to your inbox.

Drunk Driving Canada

A Lot of Canadians Still Drink and Drive

Drinking and driving in Canada has undoubtedly been on the decline over the last quarter century. While over 800 Canadians per year are injured by a drunk driver, that figure is just half of what it was in the 1980s, and continues a sharp downward trend.

But with over 120 deaths and 800 injuries attributed to drinking and driving in Canada as recently as 2011, impaired driving remains a stubborn scourge, particularly in certain areas of the country. Outside of the northern territories, Saskatchewan and Prince Edward Island hold the dubious distinction of having the most police-reported impaired driving incidents in the nation, approximately doubling the Canadian average. With alcohol considered a factor in almost 30% of deaths from vehicle crashes in the most recent national statistics, the two provinces’ increased efforts to enact stricter laws and harsher penalties could not come soon enough.


Drunk driving in Canada

Saskatchewan

In Saskatchewan, drinking and driving has been described as simply being part of the province’s “culture,” one that claims the lives of dozens, mostly young people, each year. With thousands of kilometres of rural highways and roads, the province’s police struggle to intercept even a modest fraction of the impaired driving activity in Saskatchewan. But the province’s leadership has finally decided to take action. Starting January 1, 2017, the “zero-tolerance” age for young drivers will rise from 18 to 21 (meaning any blood alcohol level, even below 0.08%, results in an immediate 60-day license suspension), while for all other drivers a blood alcohol level measured between 0.04% and 0.08% results in a 3-day vehicle seizure.

Prince Edward Island

Outside of the picturesque province, PEI is perceived as an idyllic, pastoral escape from the hustle and bustle of bigger cities and towns in Atlantic Canada and all points west. But inside, Islanders know all too well that drinking and driving remains a stubborn, deadly problem in the province. With a steady parade of drunk and drug-impaired drivers filling Charlottetown’s court system on a daily basis, the province was moved to introduce a harsher set of laws to help stem the tide. First-time offenders are required to have ignition interlocks installed (which require a breathalyzer-like test before the vehicle can be started), while second time offenders are sentenced to a minimum 30-day jail term and have their license suspended for 3 years.

The Territories

While the numbers in Saskatchewan and PEI are alarming, drinking and driving rates in the Territories suggest a downright public health emergency. Yukon and Northwest Territories, with police-reported drinking and driving incidents at more than three and five times the national average, respectively, continue to struggle with implementing effective legislation to stem the tide. With high rates of alcohol consumption and rural populations that heavily depend on cars to get around, political parties in the Territories differ on the most appropriate solution. In the Yukon, the NDP and Liberals have suggested far more aggressive rules on impounding vehicles and suspending offender’s licenses, while the Yukon Party favors an approach of hefty fines and increased education while allowing offenders to keep their vehicles.


Don’t miss our newest stories! Follow The 10 and 3 on Facebook or Twitter for the latest made-in-Canada maps and visualizations.

Don't miss our newest maps, charts and stories. Sign up now to have them delivered to your inbox.