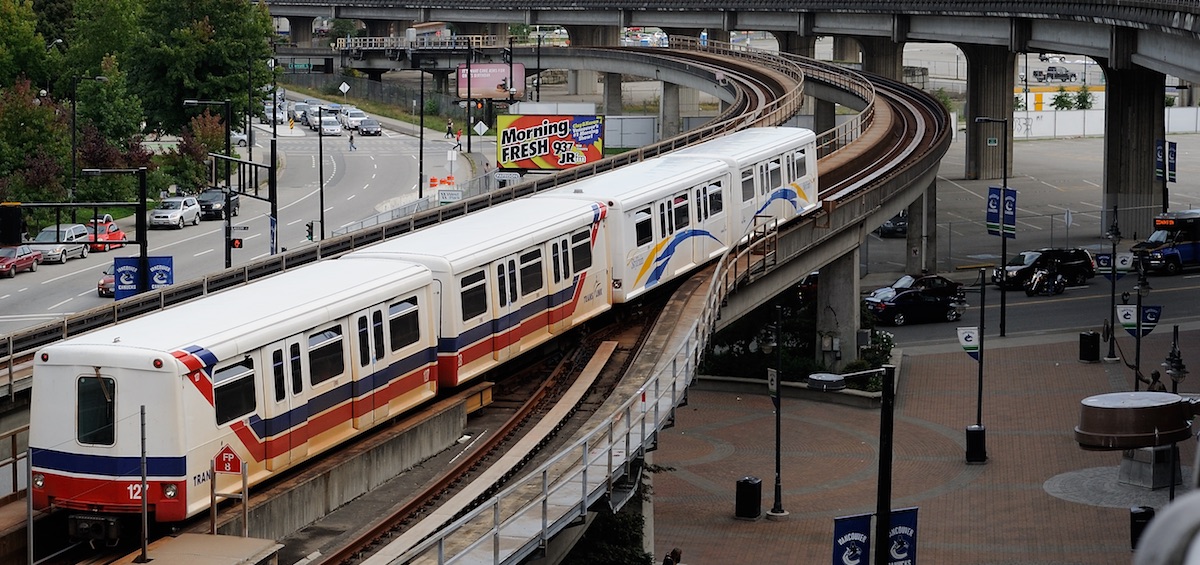
Vancouver was relatively late to the game in Canada when it came to building a modern rapid transit system, opening its first Expo line in 1985, many decades after Canada’s first subway came online under Toronto’s Yonge Street in 1954. And while Vancouver’s efficient SkyTrain system maintains relatively modest ridership numbers compared to its counterparts in Toronto and Montreal, talks of expansion to serve the ever-growing transit needs of this bustling city are continually being put forward.
As with our earlier transit heat map of Toronto, we wanted to take a high level view of the system and examine where residents in Greater Vancouver rely on public transit the most. Using data from the 2011 National Household Survey, we sliced up the Vancouver area into census tracts, and mapped what percentage of employed residents in each area use public transit as their main mode of transport to get between home and work.
Not surprisingly, some of the highest usage areas are along the Expo line, Skytrain’s very first line built for Expo 86. A significant amount of high density housing has been constructed along the line since then, which has translated to a notable reliance on public transit in those areas, including the area around Metrotown Station, which has the city’s highest usage (52.2%).
The Millennium and Canada lines were built far more recently, and the data suggests residents along those routes tend to rely somewhat less on public transit for their daily commutes. A notable exception is in the area near the Lougheed Town Centre, which was built up even before the SkyTrain arrived in the 2000s. Here, upwards of 37% of residents take public transit to work.
As we observed in Toronto, residents of certain wealthy areas tend to rely less on public transit, even when in relatively close proximity to stations. Shaughnessy, which was recently declared the most expensive housing market in the country, exhibits remarkably low usage (11.5%).
Methodology
Statistics Canada collects public transit usage data for employed residents over the age of 15. Public transit must be a resident’s main mode of transport to travel between home and work to count, as opposed to walking, cycling, driving, etc. Census tracts represent the most granular slicing of a city that Statistics Canada looks at, and typically represents an area with between 2,500 and 8,000 residents.
Don’t miss our newest stories! Follow The 10 and 3 on Facebook or Twitter for the latest made-in-Canada maps and visualizations.
