Follow The Data is our weekly curated list of cool and unusual data stories from around the country and the world. Got a hot tip on a data story? Let us know on Facebook or Twitter.
Some election analysis to begin this week’s roundup:
Slicing and Dicing the New Parliament
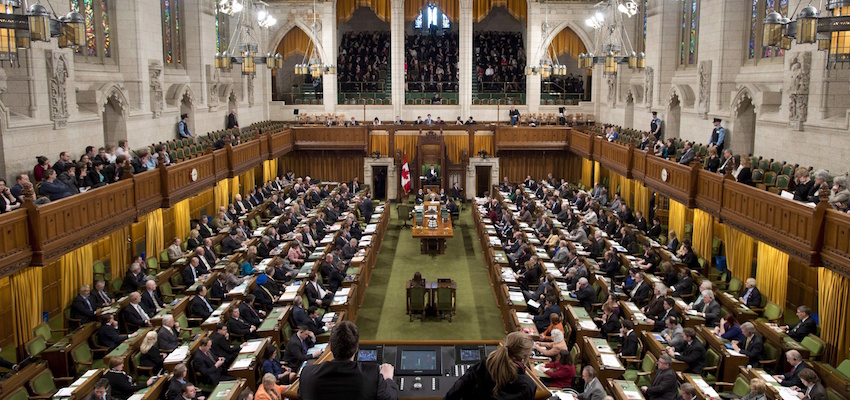
Interactive visualization showing the vitals of the new House of Commons. [Maclean’s]
First Past the Post vs Proportional Representation
What would the new House of Commons look like if Canada used proportional representation rather than a first-past-the-post voting system? [National Post]
Visualizing the Changing House of Commons
A series of simple data visualizations show how control of seats flowed between parties as a result of the election. [Toronto Star]
Google Searches Predict Election Better than Polls Do
Leading up to election day, search interest in the party leaders closely mimicked final election results, and appeared to outperform most polls. [Huffington Post Canada]
Other data stories that caught our eye:
Colour coding TO’s buildings
Mesmerizing map colour codes Toronto’s buildings by height. Easy to spot: Queen’s Park. A little trickier: the Quantum Towers in midtown. [BlogTO]
Don’t Trust Fandango’s Ratings
Fandango’s movie ratings appear artificially inflated across-the-board due to some pretty basic rounding errors in their algorithms. No, Avengers: Age of Ultron was not that good! [Five Thirty Eight]
The best (and worst) places to live in Toronto
A fun map and ranking of the best neighbourhoods in Toronto, based on factors like crime, shopping, entertainment and schools. Yonge & Eglinton (#1) and Casa Loma (#2) top the list. Proximity to subways and castles is very important, apparently. [Toronto Life]
Don’t miss our newest stories! Follow The 10 and 3 on Facebook or Twitter for the latest news and analysis.
